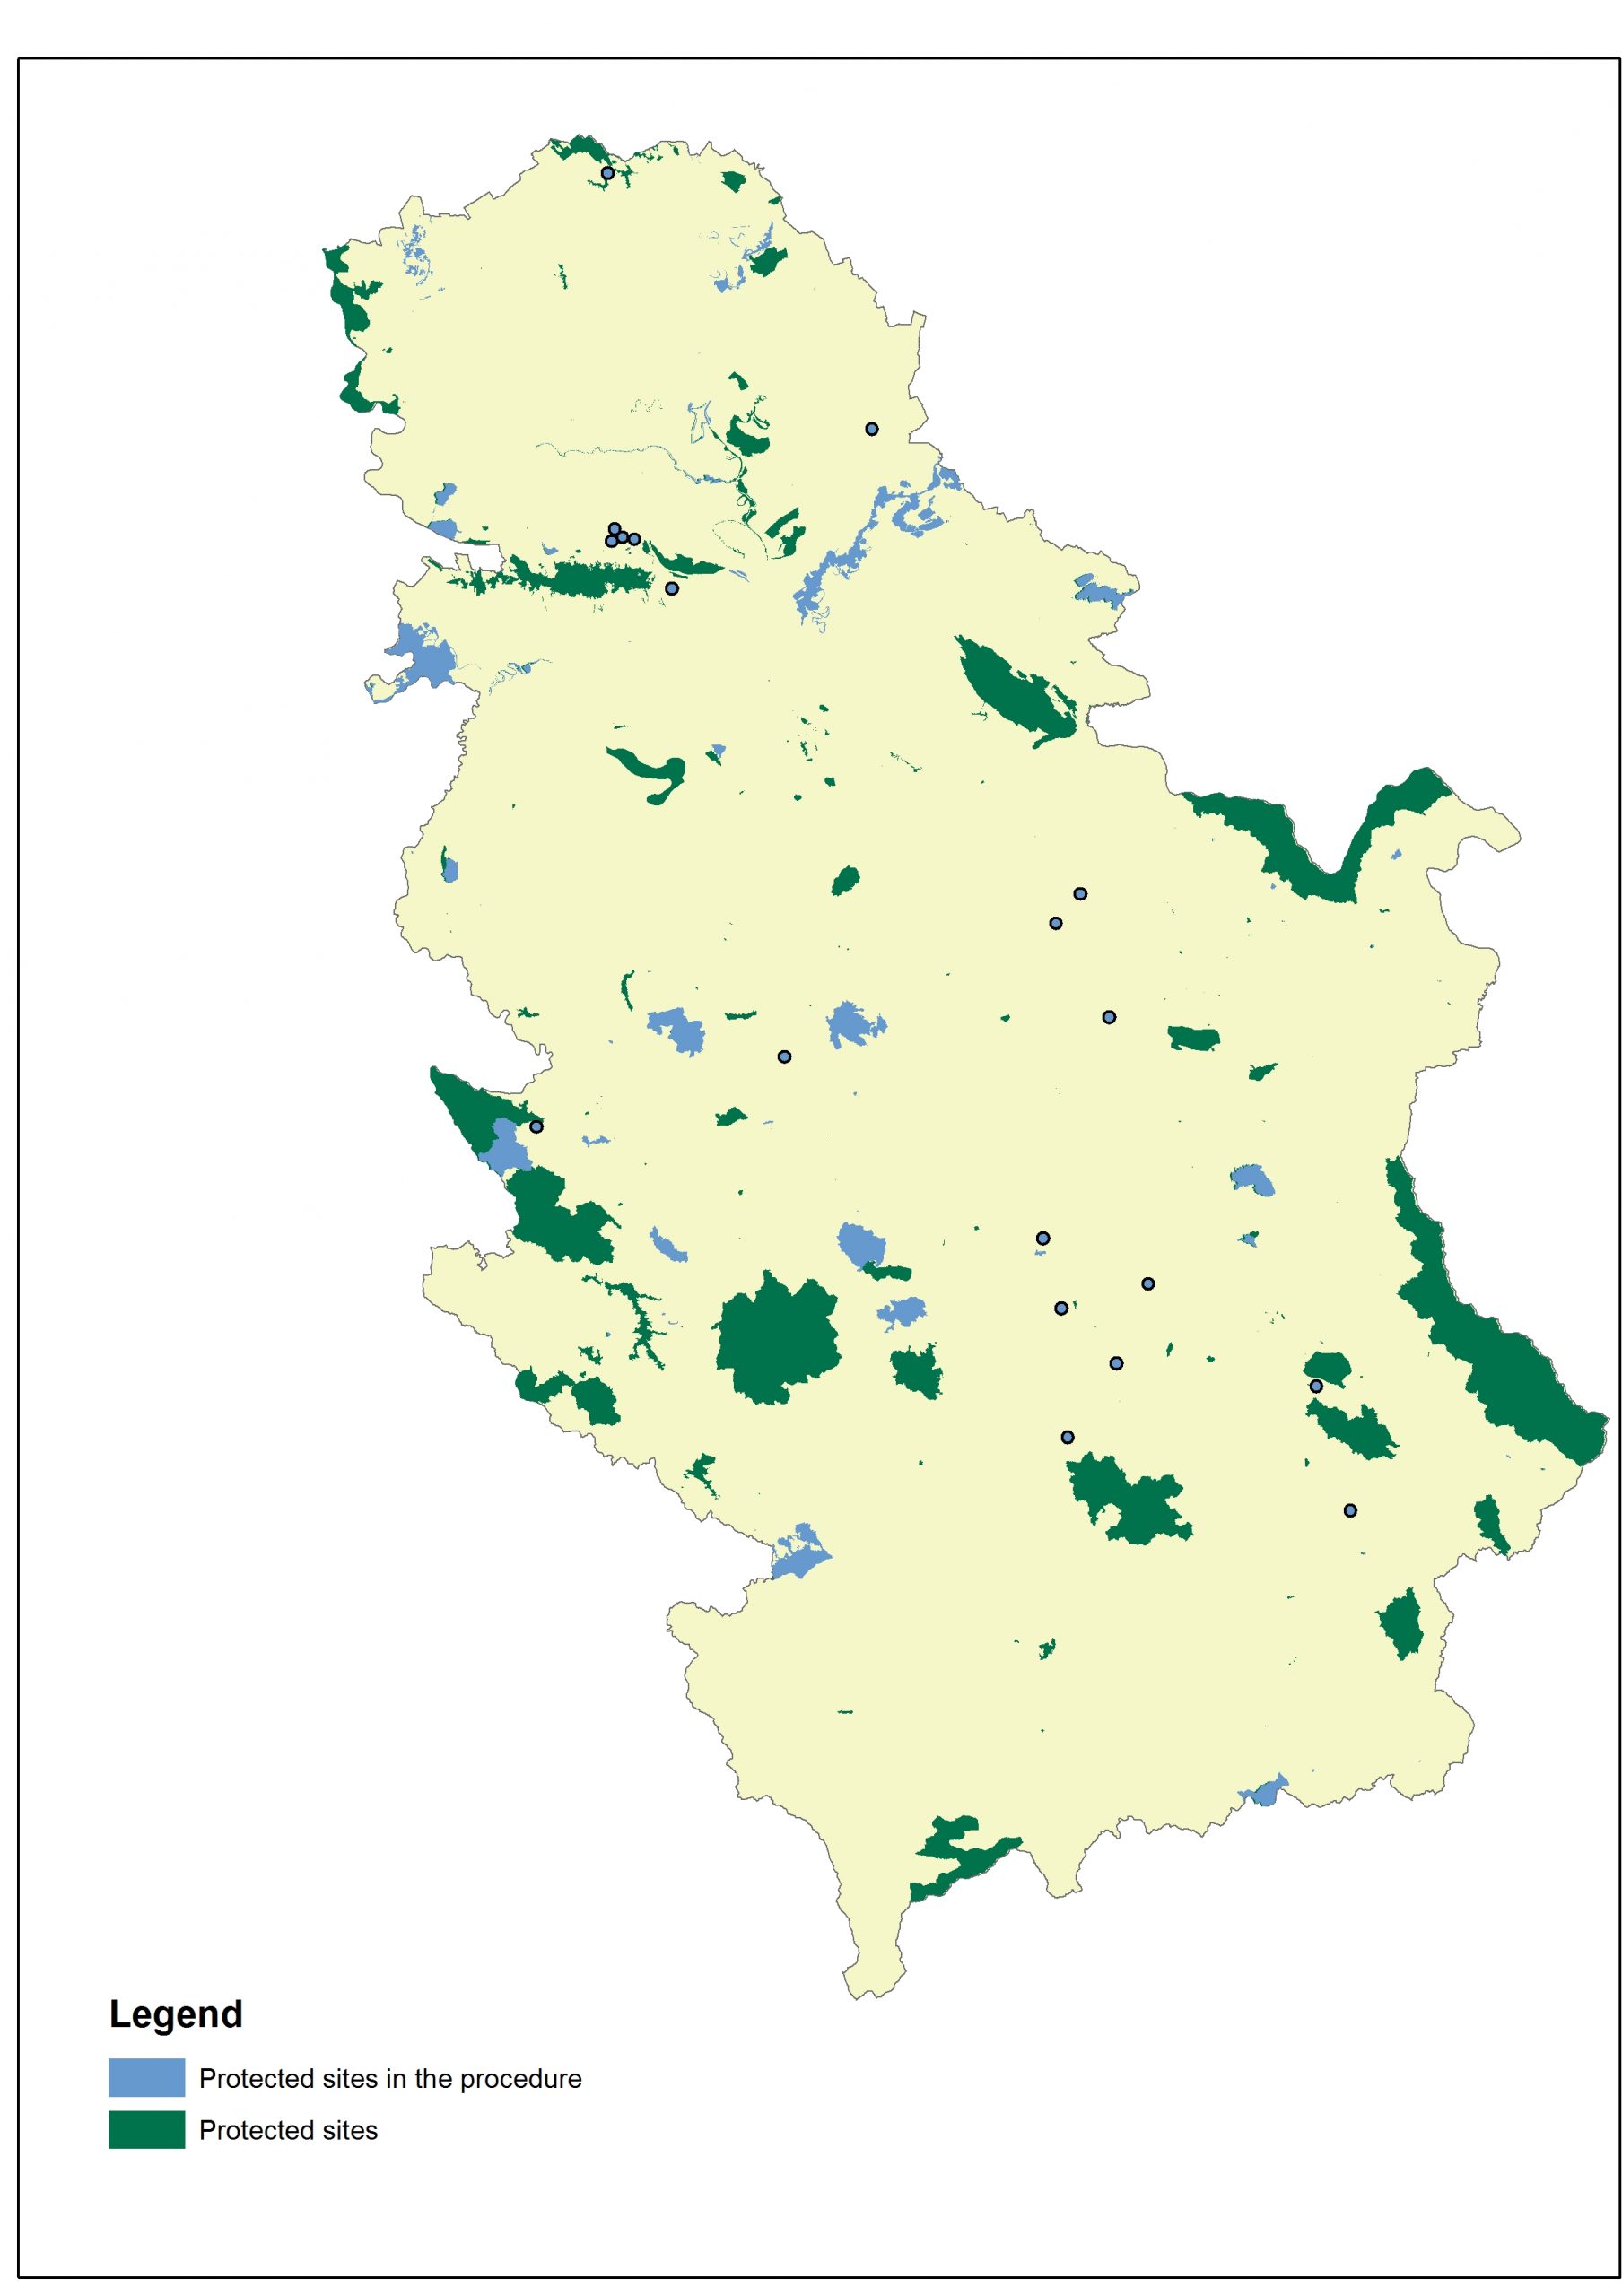
Key message: Protected area increase in Serbia
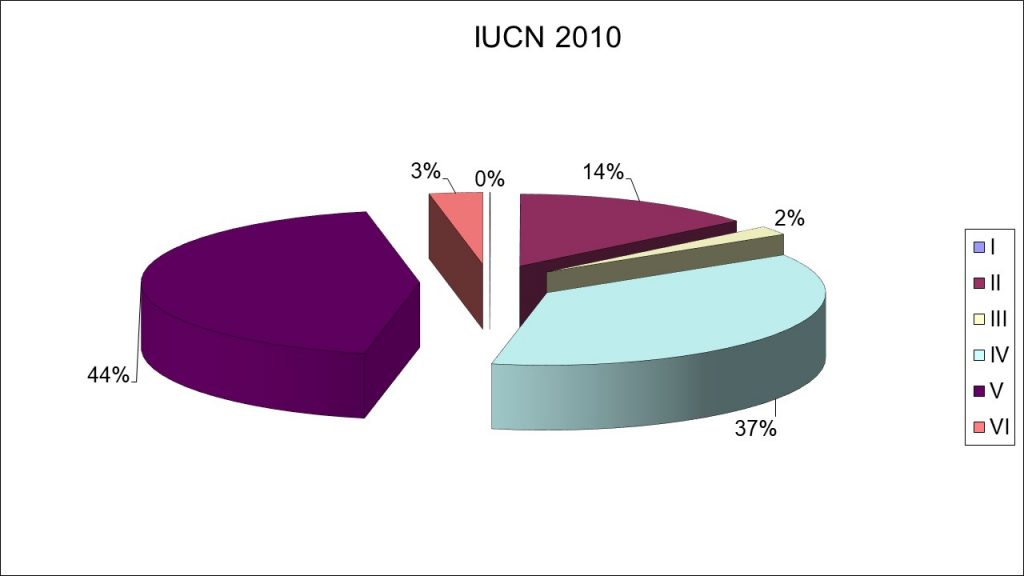
Assessment: The establishment of protected areas is a direct response of the society to the threat to nature, and aims to conserve biodiversity (species, habitats and ecosystems), according to national criteria and objectives. The indicator shows total number, structure and surface of protected areas in hectares (ha) and percentage (%) of the surface of protected areas compared to total surface of the Republic of Serbia. The total protected surface is 673,835 hectares, which represents 7.61% of the total area of Serbia. The current statistics for the territories with a defined protection regime is presented in graph below. A total of 459 protected areas are under protection. During 2018, protected area increased by 6,416 ha or about 1%. Total surface of protected areas that belong to the one of IUCN categories (I-VI) is 410,798 ha. In 2018 compared to 2010, percentage of areas under category IV decreased from 37% to 25%. Other categories more or less increased, or has retained the same proportion.
Institute for Nature Conservation of Serbia and Provincial Institute for Nature Conservation prepared studies of protection and revision for 89 more protected areas, total surface of 110,030 ha. Therefore, we can consider total protected area represents 8.82% of the entire territory of the Republic of Serbia. According to national legislation, sites with finalised studies of protection, even not designated as such, are considered protected areas.


Indicator Name: Trend of protected areas changes
Institution/Author: Environmental Protection Agency/Slaviša Popović
Use and interpretation:
Serbian Environmental Protection Agency in its Annual Reports on Biodiversity Indicators and Annual Reports on State of the Environment of the Republic of Serbia; Reports to EEA and other international conventions; Institute for Nature Protection of the Republic of Serbia, Institute for Nature Protection of the Vojvodina Province and managers of the protected areas in their regular work related to management of the protected areas. The indicator relates to the total area of protected areas. The surface of protected areas is defined by the protection of national and international regulations.
Key question(s) which indicator helps to answer
The indicator helps to answer two questions: What is total surface under protection? What is percentage of territory under protection in terms of total area of the Republic of Serbia?
Use of indicator
For measuring the progress in line with biodiversity protection issues. The establishment of protected areas is a direct response of the society to the threat to nature, and aims to conserve biodiversity (species, habitats and ecosystems), according to national criteria and objectives.
Scale of appropriate use
Total number, structure and surface of protected areas in hectares (ha).
Percentage (%) of the surface of protected areas compared to total surface of the Republic of Serbia. The indicator is compatible with indicators of the same scale.
Potential for aggregation:
Meaning of upward or downward trends (“good or bad”)
An increase in number and percentage of protected areas in total is observed every year, regardless of the category of protection.
Possible reasons for upward or downward trends:
The indicator is determined annually. It is very important for monitoring the system for biodiversity protection in Serbia. Practically, increase in number and surface of protected areas should have a positive impact upon biodiversity of many wildlife species.
Implications for biodiversity management of change in the indicator:
The indicator is traditionally described in annual state of the environment reports in Serbia, and it is determined as biodiversity indicator, according to the Rulebook on the National list of environmental protection indicators (Official Gazette of the Republic of Serbia No. 37/2011).
Units in which it is expressed:
In the annual reporting, the units as hectares (ha) and percentages of the total area (%) are used to express indicators.
Description of source data:
Institute for nature conservation of the Republic of Serbia
Institute for the nature conservation of the Vojvodina Province
Calculation procedure:
The indicator is calculated by analysing the number and size of protected areas in each category annually, from GIS data base.
Most effective forms of presentation:
(graph types, maps, narratives, etc.-give examples where possible):
The best ways to present this indicator are tables and graphs and they provide opportunity to monitor progress regarding this indicator and to record trends observed.
Limits to usefulness and accuracy:
Slow change in fulfilling obligations from the Spatial plan of the Republic of Serbia, concerning the number and surface of protected areas, due to procedures that depend on the Government.
Updating the indicator:
Statistical data are updating annually.
Closely related indicators
Ecological network
Additional information and comments
Serbian Environmental Protection Agency collects data through the Information system of environmental protection, as well as in direct cooperation with relevant institutions for certain thematic areas, and prepares the Report on biodiversity indicators, based on Article 76 and 77 of the Law on Environmental Protection (Official Gazette of RS No. 135/04, 36/09, 36/09 – state law, 72/09 – state law and 43/11). This report gives an overview of the state of biodiversity in the Republic of Serbia in 2015 on the basis of available data, which is the indirect insight into the realization of the goals and measures of environmental policy defined by strategic and planning documents, such as the Biodiversity Strategy of the Republic of Serbia for a period of 2011 to 2018 (Official Gazette of RS No. 13/11), the National Environmental Protection Programme (Official Gazette of RS No. 12/10), and the National Strategy for Sustainable Development (Official Gazette of RS No. 57/08).
Table 1: Protected areas changes per categories and number of sites
| ha | 1980 | 1985 | 1990 | 1995 | 2000 | 2005 | 2010 | 2015 | 2016 | 2017 | 2018 |
| Number of protected cites | 121 | 141 | 173 | 217 | 257 | 331 | 381 | 463 | 469 | 459 | 459 |
| National Park | 89001 | 119986 | 158986 | 158986 | 158986 | 158986 | 159000 | 150225 | 150225 | 150225 | 150225 |
| Nature Park | 12946 | 12946 | 14114 | 14248 | 157354 | 233949 | 212780 | 214385 | 217057 | 294086 | 298088 |
| Extraordinary Landscape | 18211 | 19810 | 19810 | 19810 | 24666 | 36434 | 45645 | 65606 | 65594 | 65606 | 66195 |
| Natiural Reserve | 51764 | 71433 | 72412 | 73400 | 82543 | 83519 | 89074 | 134213 | 134450 | 134170 | 139938 |
| Cultural Historic Monument | 2452 | 2700 | 3756 | 4075 | 4075 | 4075 | 3774 | 2119 | 3491 | 2119 | 2119 |
| Regional Nature Park | 4003 | 4003 | |||||||||
| Nature monument | 522 | 5130 | 5347 | 5448 | 7315 | 7524 | 8252 | 10778 | 10536 | 10812 | 10868 |
| Protected Habitat | 1120 | 1414 | 1414 | 1418 | |||||||
| 435453 | 525001 | 519039 | 578446 | 578705 | 662435 | 66931000,00% | |||||
| 6,02 | 6,46 | 6,53 | 6,54 | 7,47% | |||||||
| Number of protected areas | 121 | 141 | 173 | 217 | 257 | 331 | 381 | 463 | 469 | 459 |
Table 2: Trend of protected areas changes
| I | II | III | IV | V | VI | ||
| IUCN 2018 | ha | 192 | 123552 | 9282 | 142569 | 294999 | 2955 |
| IUCN 2010 | 141 | 58212 | 8269 | 151814 | 179621 | 12741 |