Key message: In the period from 2009-2018, 222 facility for renewable energy production of electricity have been built
Assessment: Since 2009, when the Republic of Serbia established a legal framework with incentive measures (“feed-in” tariffs), 222 new facilities were built by December 2018, for production of electricity from renewable energy sources. The total installed capacity of 111 MW is produced by the following:
1) 100 small hydro power plants with total installed capacity of 63 MW (including two old, reconstructed plants: Ovčar Banja and Međuvršje);
2) 105 solar power plants of 8.78 MW;
3) 4 wind power plants with a capacity of 25 MW, and 5 wind power plants gained the status of a temporarily privileged producer with a total power of 475 MW;
4) 13 biogas power plants with a total power of about 14 MW;
Source of data is the Register of privileged producers of electrical energy.
(http://mre.gov.rs/doc/registar-020818.html)
Indicator Name: Renewable energy sources
Institution/Author: Environmental Protection Agency/Slaviša Popović
Use and interpretation:
Key question(s) which indicator helps to answer Renewable energy use and treats on biodiversity
Use of indicator
Scale of appropriate use
Potential for aggregation:
Meaning of upward or downward trends (“good or bad”)
Possible reasons for upward or downward trends:
Implications for biodiversity management of change in the indicator:
Possible treats and benefits for biodiversity, especially in the field of river fragmentation and migration of birds.
Units in which it is expressed:
Number of power plants by categories (wind, hydro, biomass and biogas), by year (No)
Production capacity of electricity by categories (wind, hydro, biomass and biogas), by year (kW)
(e.g. km2, number of individuals, % change)
Description of source data:
Register of privileged electricity producers by the Ministry of Energy with the data about location and capacity for production by categories
(origins, dates, units, sample size and extent, custodians)
Calculation procedure:
Number per year
kW per year
Coordinate for GIS presentations
(include appropriate methods and constraints for aggregation):
Most effective forms of presentation:
Graph, maps
(graph types, maps, narratives, etc.-give examples where possible):
Limits to usefulness and accuracy:
(e.g. slow change in response to pressures, poor quality data, limited scope for updating)
Updating the indicator:
Yearly
(how often? What is the process?)
Closely related indicators
River fragmentation index
Energy production
Additional information and comments
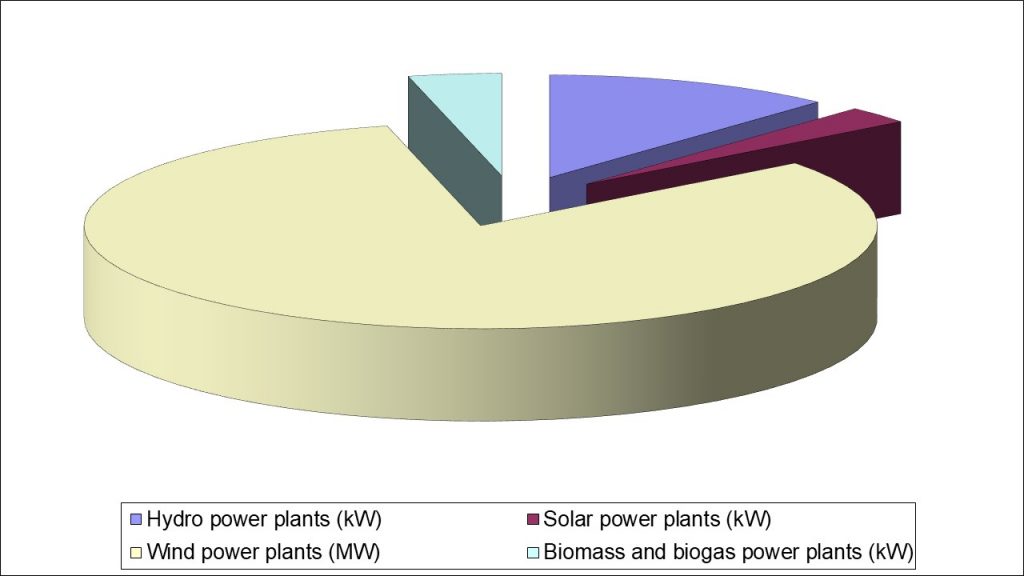
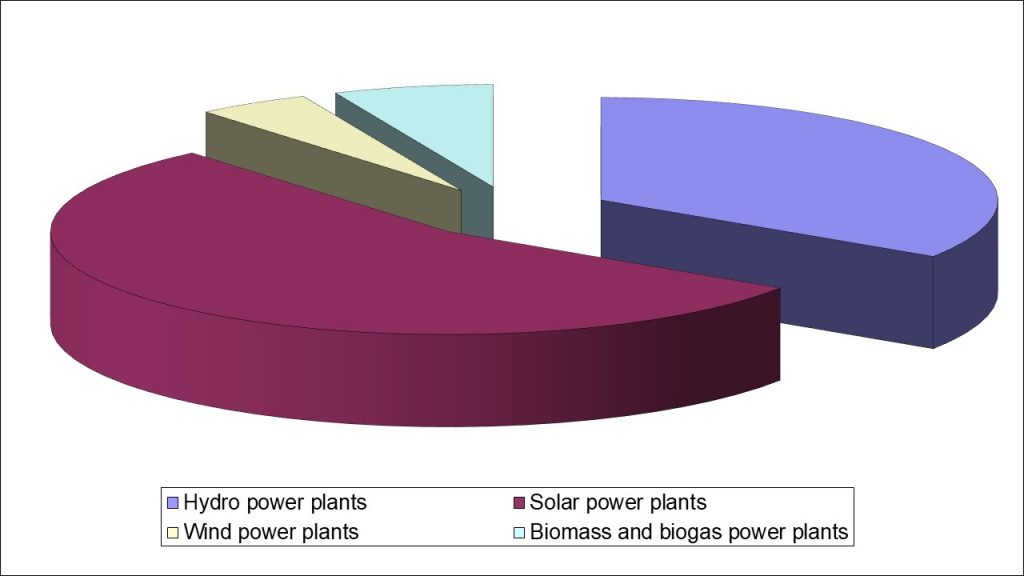
Table 1: Structure and installed capacity of all types of power plants on renewable energy sources
| Hydro power plants | 126 | Hydro power plants (kW) | 82282 |
| Solar power plants | 201 | Solar power plants (kW) | 18937 |
| Wind power plants | 17 | Wind power plants (MW) | 566910 |
| Biomass and biogas power plants | 24 | Biomass and biogas power plants (kW) | 26384 |
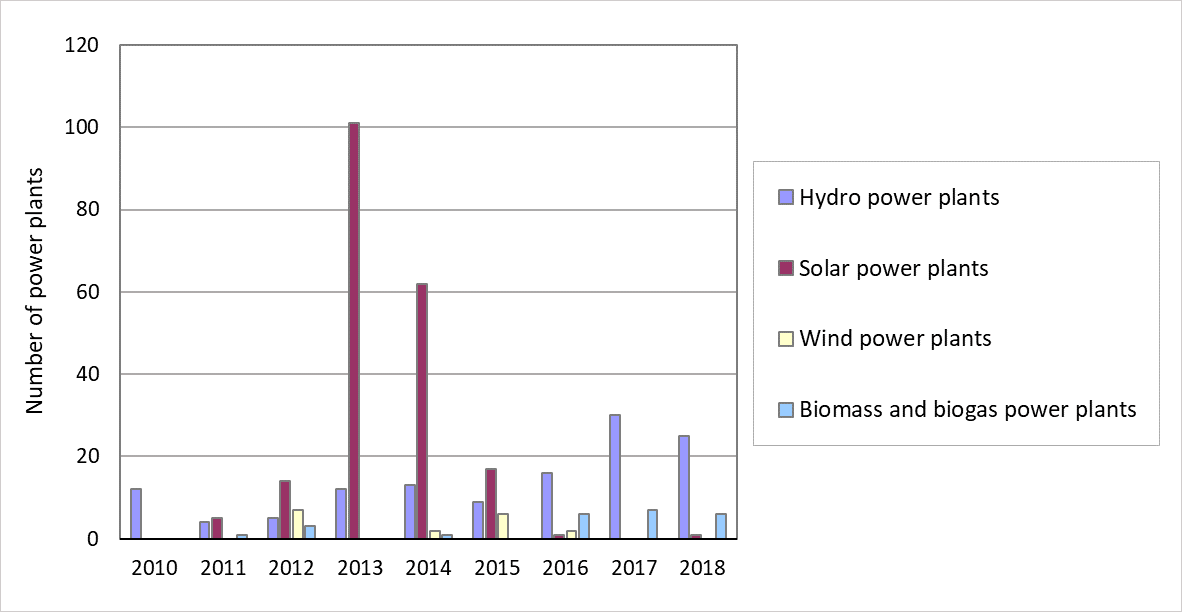
Table 2: The number of all types of renewable energy power plants
| 2010 | 2011 | 2012 | 2013 | 2014 | 2015 | 2016 | 2017 | 2018 | total | |
| Hydro power plants | 12 | 4 | 5 | 12 | 13 | 9 | 16 | 30 | 25 | 126 |
| Hydro power plants (kW) | 3327 | 2091 | 3078 | 15344 | 10836 | 4360 | 7986 | 18014 | 17246 | 82282 |
| Solar power plants | 5 | 14 | 101 | 62 | 17 | 1 | 1 | 201 | ||
| Solar power plants (kW) | 140 | 5019 | 7151 | 5361 | 825 | 16 | 425 | 18937 | ||
| Wind power plants | 7 | 2 | 6 | 2 | 17 | |||||
| Wind power plants (MW) | 50950 | 16500 | 482960 | 16500 | 566910 | |||||
| Biomass and biogas power plants | 1 | 3 | 1 | 6 | 7 | 6 | 24 | |||
| Biomass and biogas power plants (kW) | 1738 | 2624 | 500 | 8105 | 6733 | 6684 | 26384 |
Serbia