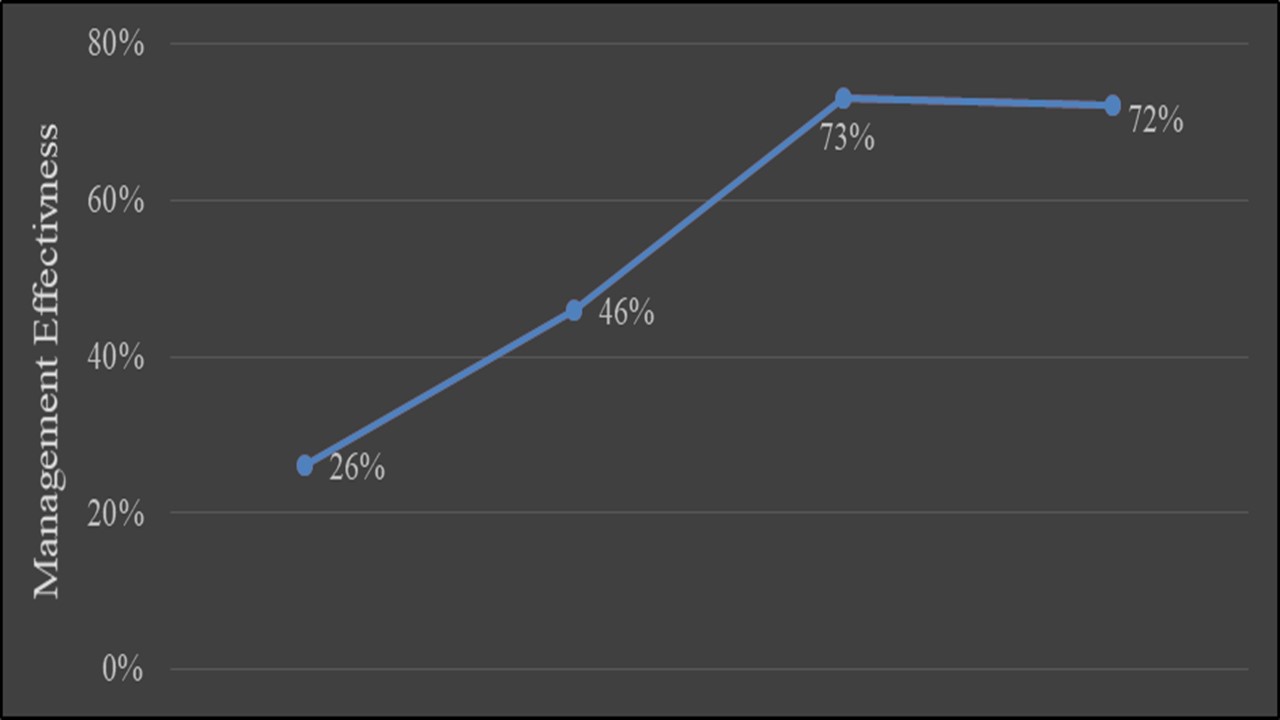
Key message: The efficiency of management of the Protected Area “Dolina Pčinje” in 2017 amounts to 72%
Assessment: The World Bank, the World Wildlife Fund (WWF) and the Global Environmental Facility (GEF) propose the application of appropriate methodology that would allow for monitoring of the management in these areas with the aim of directing priority conservation and protection activities. The indicator provides the possibility, in addition to the assessment of effectiveness, to make an assessment of the managerial, sociological and environmental conditions of the protected area. The indicator can help to identify strengths, constraints and weaknesses in the management of natural resources, to analyse the intensity of activities and the distribution of threats and pressures, then to identify areas of high environmental and social importance and vulnerability, as well as to point out the priorities in the protection of individual protected areas.
The difference in the management effectiveness in the four conducted studies (2009 – 2017) in the Protected Area “Dolina Pčinje“ was noticed (Džoljić, 2017). The large differences in the results of the research for Protected Area “Dolina Pčinje” in the initial research period can be attributed to the lack of objectivity and the participation of different respondents (graph above) having in mind the interview method. The first three surveys were conducted within the project “Ensuring Financial Sustainability of the Protected Area System of Serbia”, which included 21 pilot areas (Williams, 2016). According to the latest research of the Protected Area “Dolina Pčinje” management, large number of threats were detected, marks of those with medium or even poor influence on degradation of the site value. There are settlements and houses, livestock and grazing, energy production, including hydropower dams, also the overall impact on biological resources of the area and climate change and weather, and so on.
Literature:
Džoljić, J. (2017). Savremene metode praćenja radionuklida i ostalih parametara stanja životne sredine u funkciji optimalnog upravljanja zaštićenim područjima Pčinjskog okruga. Doktorska disertacija. Fakultet za ekologiju i zaštitu životne sredine, Univerzitet „Union-Nikola Tesla”, Beograd, Srbija. Retrieved from http://nardus.mpn.gov.rs/handle/123456789/9121
Williams, S. (2016). Ensuring Financial Sustainability of the Protected Area System of Serbia, PIMS 4281, Terminal Evaluation Vol. 1. Retrieved from http://www.rs.undp.org/content/dam/serbia/docs/Our Projects/UNDP_SRB_PA.pdf
Indicator Name: Protected Area Management Effectiveness in Serbia
Institution/Author: The Academy of Applied Technical and Preschool Studies – Department Vranje, Serbia/dr Jovana Džoljić
Use and interpretation:
The authorities have not defined official methods needed to estimate management effectiveness of protected areas in Serbia. However, World Wild Fund (WWF) and Global Environmental Facility (GEF) suggest implementation of appropriate methodology which would provide monitoring of protected area management, so priority activities of nature protection and conservation could be defined and implemented.
The indicator provides opportunity to estimate effectiveness of protected area together with the management, sociological and environmental protection state. It can be also used to identify the strengths, limitations and weaknesses of the site management, to analyse the intensity of action and the distribution of threats and pressures, then to identify areas of high environmental and social importance and vulnerability, as well as to point out protection priorities of individual protected areas.
Key question(s) which indicator helps to answer
How well protected area is being managed? What are the main pressures and threats defined for protected area? Is there any new identified threat or pressure to protected area?
Use of indicator:
The indicator can be used for monitoring management effectiveness of individual protected area, so the stakeholders can track management improvement. Also, it can help to authorities that are in charge of protected area (line Ministry, Institute for Nature Conservation etc.) to understand and improve state and management of area. Associations, NGOs and interested individuals could obtain information to establish the base for further research and new projects that could improve the status of the area.
Scale of appropriate use
National and regional level.
Potential for aggregation:
Regarding the applied methodology, used around the world, estimation is based on the analysis results of individual protected area so estimation can be aggregated for national or regional level. Results of the management effectiveness analysis of individual protected area could provide information about the effectiveness of different categories of protected areas at Serbia or information about general estimation for the country (Serbia).
Meaning of upward or downward trends (“good or bad”)
Through time period analysis, the results would show upward trend meaning improvement of management mode or downwards trend that implies that conducted activities or changes were not efficient enough.
Possible reasons for upward or downward trends:
The improvement of protected area management shows upward trend that can be accomplished by better education of employees included in research, so they can better understand problems and subject of research. Training of employee teams is one of the key activity that can contribute to greater consistency in responding. Also, application of effective measures for the area protection and preservation leads to better management, improvement of the position of employees, enhancing cooperation with the local population, etc.
Downwards trends of estimation could be noticed if occurs changes in team of employees included in research, also due to misunderstanding, inadequate approach to the subject, or just avoiding answering the questions, due to destructive activities or enhancing the anthropogenic pressure on areas, bad cooperation with local community could be also a reason, and so on.
Implications for biodiversity management of change in the indicator:
The indicator is created due to necessity of creating Report to Convention on Biological Diversity.
Units in which it is expressed:
Estimation of management efficiency of protected area is expressed in percentage (%).
Description of source data:
Participation of protected area stakeholders in the implementation standardised, scoring METT (Management Effectiveness Tracking Tool) questionnaire.
Calculation procedure:
The assessment is done by analysing the answers in the scoring questionnaire (METT). The result is expressed as the ratio of the total score obtained through the answers and the maximum score.
Most effective forms of presentation:
The best way to present the result is as a trend at graphs combined with narrative report, explaining identified threats at site together with trend changes.
Limits to usefulness and accuracy:
Limitations of the questionnaire use can be explained by the lack of interest, or the lack of understanding importance of defining management efficiency level by stakeholders. Also, large number of questions, together with unuseful and non-objective answers from the respondents can lead to wrong results. The insufficient expertise of the employees involved in the assessment can also limits the ability to make an adequate assessment.
Updating the indicator:
The indicator should be updated every 5 years or after the end of the Protected Area Management Plan.
Closely related indicators
Protected Area Management Effectiveness, https://www.bipindicators.net/indicators/protected-area-management-effectiveness.
Additional information and comments
Related to Aichi Biodiversity Target 11, Indicator should be implemented to all protected areas in Serbia
Table: Protected Area Management Effectiveness
| Year | Management Effectivness |
| 2009 | 26% |
| 2011 | 46% |
| 2015 | 73% |
| 2017 | 72% |
Serbia