Key message: In the period from 1990-2012. On the territory of MAB in Serbia, number of forests has increased
Assessment: Nature Park “Golija” in Serbia is one of the most forested areas in Serbia. In the period from 1990 to 2018, there was an increase in the area under the forests from 47 588.30 ha in 1990 to 48 240.24 ha. The recorded regeneration of forest ecosystems correspond to that in the period 1990-2012 on the whole territory of Serbia the forests have increased. One of the reasons for the renewal of the vegetation is reduced anthropogenic pressure in this area. In these regions, in the last twenty years, there has been significant migration of people to cities and the abandonment of the village, which is why the areas are exposed to natural succession. According to the results of the latest CORINE Land Cover in 2018 the development of two areas with sports and recreational facilities have been identified, which occupy an area of 133.54 ha and can significantly improve the development of the local economy.
In the area of nature park in 1990, the area under the pastures covered the territory of 4 012.97 ha, but in the next 10 years it was reduced to only 1 757.06 ha, which is accompanied by a decrease in the number of these habitats. In the following period (2000 – 2012), the area was slightly changed with the trend of decreasing the number of habitats.
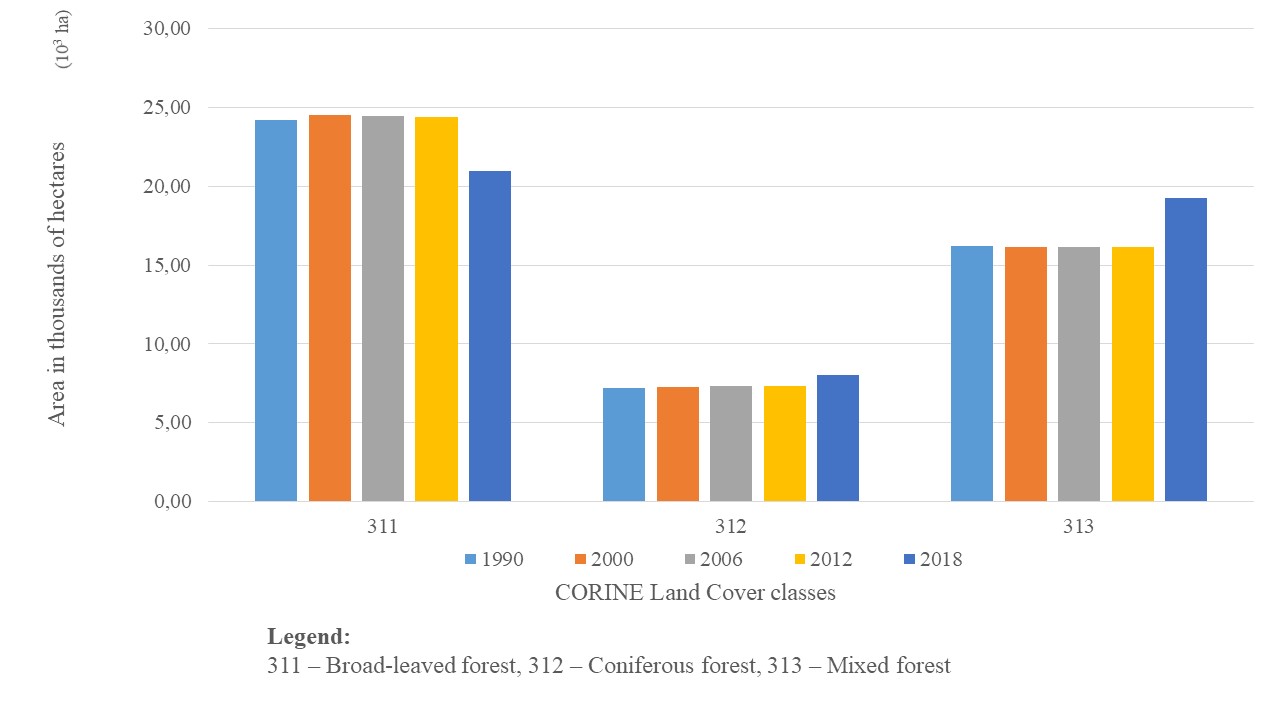
The reason for this may also be the conversion of these habitats into cultivated land (4 631.74 ha in 1990, and 5 004.82 ha in 2012). In 2018, an increase in the area under pastures was recorded along with an increase in the number of habitats, while the complexes of the cultivated land show a decrease in the area but an increase in the fragmentation of this habitat type. The class of mainly agricultural land with a significant area under natural vegetation shows an increase in the area (from 9,928.74 ha in 1990 to 10 829.65 ha in 2018), while simultaneously consolidating and linking these habitats, which indicates the restoration of vegetation and the dominant processes of natural succession. Since the beginning of the protection and management of the nature park and the definition of the area of the biosphere reservation (2001), there has been an increase in areas under forest ecosystems. Surfaces under broad-leaved forests show a decrease in the area in the period 1990 – 2018 (from 24,189.45 ha to 20,971.99 ha), at the expense of mixed (16,116.34 ha to 19,265.27 ha) and coniferous forests (7 182.51 to 8 002.97 ha), while reducing fragmentation in all three classes. Natural grasslands mostly have stable ecosystems, as well as the trend of increasing and strengthening of these habitats (2 418.40 ha in 2018). The transition zone forest / shrub area shows minor oscillations in the surface, but also a decrease in fragmentation, and in 2018 it occupies an area of 7 715.77 ha. Reducing the area of areas with diluted vegetation is accompanied by an increase in the number of these habitats, which can be partly explained by the succession of vegetation to other classes.

Indicator Name: Protected Area „Golija“, as a part of UNESCO MAB biosphere reserve
Institution/Author: The Academy of Applied Technical and Preschool Studies – Department Vranje, Serbia/dr Jovana Džoljić
Use and interpretation:
Nature Park “Golija” in Serbia is one of the most forested areas in Serbia. In the period from 1990 to 2018, there was an increase in the area under the forests from 47 588.30 ha in 1990 to 48 240.24 ha. The recorded regeneration of forest ecosystems correspond to that in the period 1990-2012 on the whole territory of Serbia the forests have increased. One of the reasons for the renewal of the vegetation is reduced anthropogenic pressure in this area. In these regions, in the last twenty years, there has been significant migration of people to cities and the abandonment of the village, which is why the areas are exposed to natural succession.
Key question(s) which indicator helps to answer
Is there evidence about changes in habitat types in biosphere reserves? What is the level of changes and which classes are the most exposed?
Use of indicator
According to the results of the latest CORINE Land Cover in 2018 the development of two areas with sports and recreational facilities have been identified, which occupy an area of 133.54 ha (Fig. below) and can significantly improve the development of the local economy.
Scale of appropriate use
Regional level
Potential for aggregation: Change analysis of CLC habitat types vary among the protected areas.
Meaning of upward or downward trends („good or bad“)
Trends changes of CORINE Land cover habitat types, upward or downward, depends on a habitat type and represent positive or negative effects of activities conducted at site.
Possible reasons for upward or downward trends:
Both the upward trend and increment of CLC habitat type size depend on a type of class. In some classes it can occur as a result of natural succession, regeneration and expansion of habitat. While in some classes represent results of anthropogenic pressure. It also shows the effectiveness of the implemented conservation measures.
The downward trend, regarding the CLC habitat type, mainly is related to enhancement of anthropogenic pressure to site, due to overexploitation of resource (e.g. deforestation[1]). Pressures that occurs are not just results of anthropogenic activity. Natural disasters related to climate changes like wildfires, wind etc. Can also have negative effect on a fragile ecosystems.
Implications for biodiversity management of change in the indicator:
Indicator is created due to necessity of creating Report to Convention on Biological Diversity.
Units in which it is expressed:
Surface in hectares (ha) or percentage of the territory or part of the territory. Regarding the land cover fragmentation, number of identified polygons is used.
Description of source data:
European Environment Agency (https://www.eea.europa.eu/publications/COR0-landcover), Serbian Environmental Protection Agency.
Calculation procedure:
According to CORINE Land Cover data, for particular Protected Area, were determined classes and their size in hectares (ha) and number of polygons for following years 1990, 2000, 2006, 2012 and 2018 using QGIS software. Percentage of change detection and number of polygons of each class are determined.
Most effective forms of presentation:
The most effective way to present results is using graphs, which helps to monitor trend-changes of classes. In combination with narratives are very useful regarding the possible explanation of the change causes.
Limits to userfelness and accuracy:
Smaller changes in vegetation cover, less than 25 ha regarding the Corine Land Cover methodology, cannot be identified. Precision of data relative to the surface to be monitored.
Updating the indicator:
(how often? Whats is the process?)
Indicator should be updated every 6 years, with coming-out new CLC map of Europe.
Closely related indicators
Forest area as a proportion of total land area, Habitat changes in UNESCO MAB biosphere reserves, CORINE Land Cover habitat changes in Protected Area in Serbia
Additional information and comments
Analysis should be conducted for the bigger protected areas, first of all to categories of National and Nature Parks etc.
Reference:
Popovic, S., & Dzoljic, J. (2016). Serbian Forest Indicators by CORINE Land Cover. Saarbucken, Germany: LAP LAMBERT Academic Publishing. Retrieved from http://www.sepa.gov.rs/download/publikacije/SerbianForestIndicatorsCorineLandCover.pdf
[1] https://www.cins.rs/zbog-ilegalne-sece-godisnje-nestane-hiljade-hektara-suma/
Table: Number of CORINE habitat types in PA
| poligons | |||||
| 90 | 2000 | 2006 | 12 | 18 | |
| 142 | 0 | 0 | 0 | 0 | 2 |
| 231 | 55 | 35 | 32 | 32 | 52 |
| 242 | 59 | 63 | 60 | 60 | 39 |
| 243 | 133 | 133 | 131 | 131 | 125 |
| 311 | 73 | 72 | 72 | 72 | 63 |
| 312 | 53 | 52 | 52 | 52 | 43 |
| 313 | 88 | 89 | 89 | 89 | 49 |
| 321 | 33 | 34 | 36 | 36 | 32 |
| 324 | 81 | 91 | 99 | 99 | 96 |
| 333 | 3 | 4 | 5 | 5 | 5 |