Assessment: The indicator Progress in Contaminated Site Management follows the progress in managing localised sources of soil pollution at national and international levels. The Environmental Protection Agency is responsible for introduction and management of the National Cadastre of Contaminated Sites, which is an integrated part of the Environmental Information System in the Republic of Serbia. Based on the first data published by the Environmental Protection Agency in 2007, 375 sites were identified in the territory of the Republic of Serbia, where soil pollution was confirmed by laboratory analyses of soil and groundwater in close proximity to localised pollution sources, and where pollution had been present for a longer period of time. Local soil pollution is found in the areas of intensive industrial activity, inadequate landfills, mines, at the sites of various accidents.
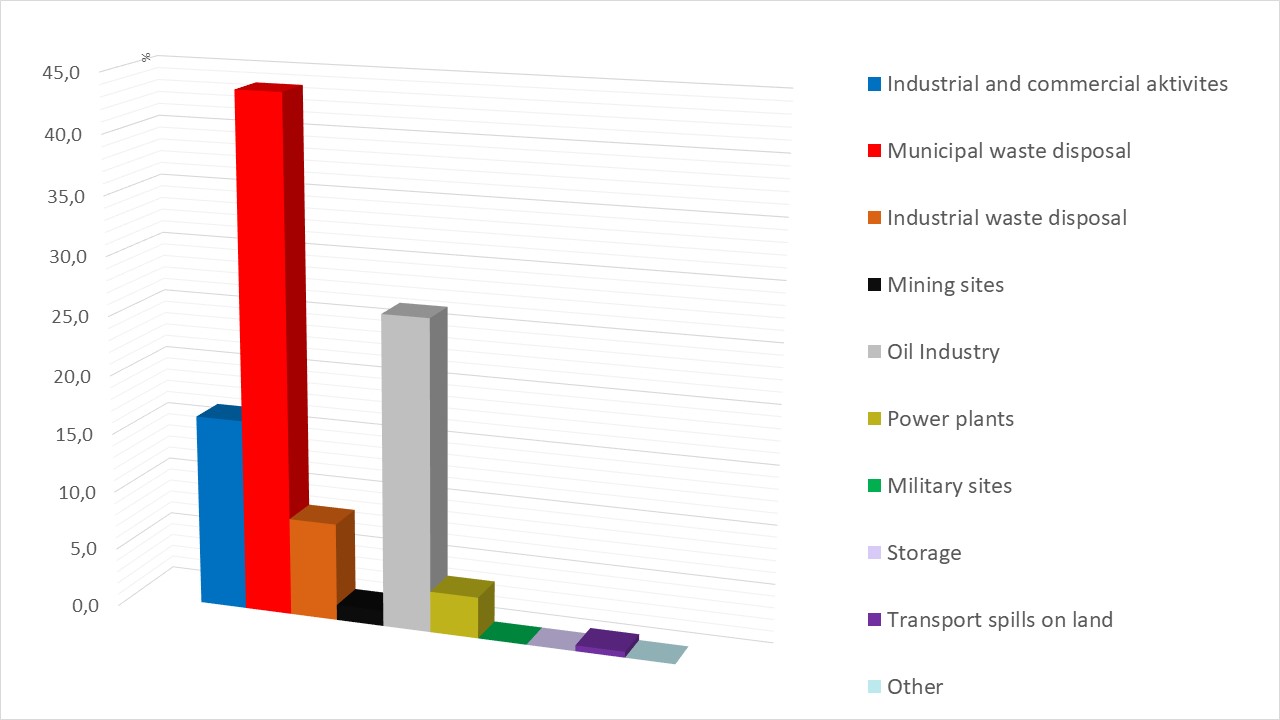
The highest share in the identified sites belongs to municipal waste disposal sites with 43.7%, followed by oil industry with 26.4%, and industrial and commercial sites with 16.3% (Figure 1). In the territory of the Republic of Serbia 709 potential contaminated and contaminated sites were identified in 2017.

Figure 1. Share of main types of localised sources of soil pollution in the total number of identified sites (%)

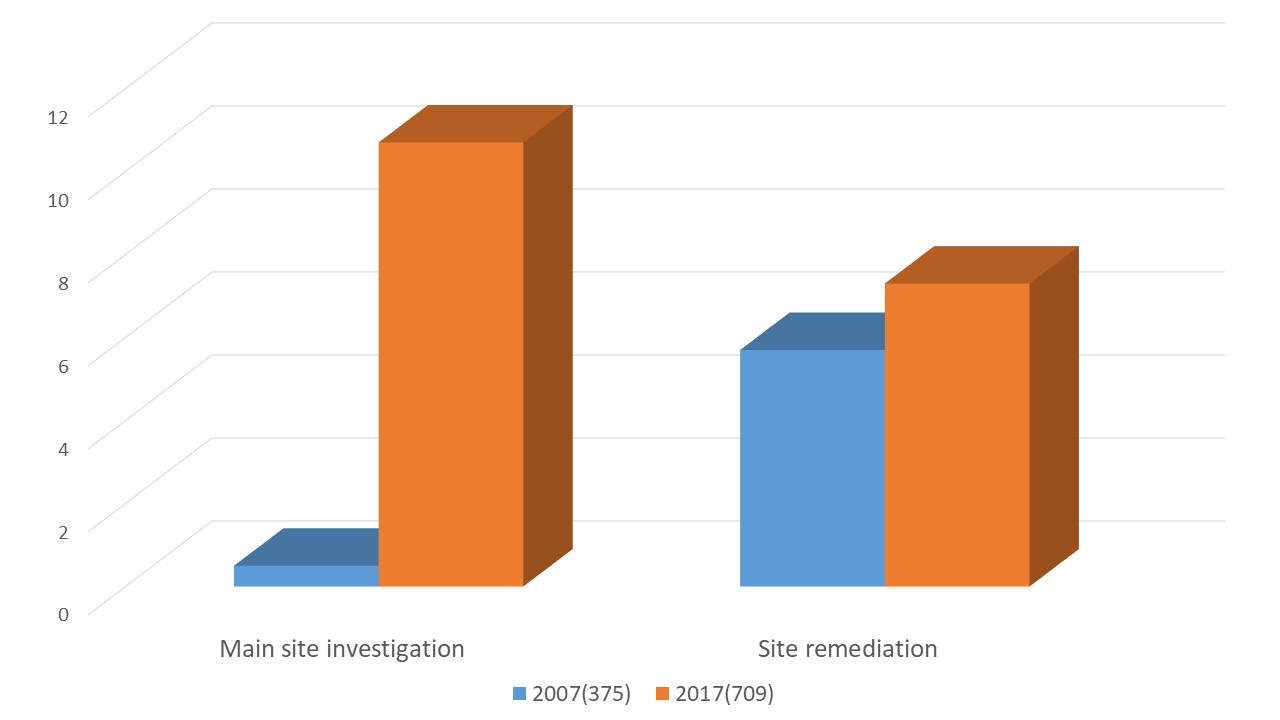
Figure 2. Progress in contaminated sites management
Following the progress in 2007-2017, it can be concluded that the share of sites where main site investigations were carried out, as well as site and remediation activities, was higher in 2017 (Figure 2).[1]
[1] Kukobrat, L., Vidic, D., SiljicTomic, А. 2018. Towards decontamination of land in Republika Srpska, Ministers’ close the environment, the Environmental Protection Agency, ISBN: 978-86-87159-20-4 http://www.sepa.gov.rs/download/zemljiste/KaDekontaminacijiZemljista.pdf
Indicator Name: Progress in Contaminated sites management
Institution/Author: Environmental Protection Agency/Dr Dragana Vidojević
Use and interpretation:
Key question(s) which indicator helps to answer
Use of indicator
Scale of appropriate use
The indicator Progress in Contaminated Site Management follows the progress in managing localised sources of soil pollution at national and international levels.
Potential for aggregation:
Meaning of upward or downward trends (“good or bad”)
Upward trend – Good: Share of sites where main site investigations were carried out, as well as site remediation activities, is higher.
Possible reasons for upward or downward trends:
Increased expenditures on the management of contaminated sites, increase in funds
Implications for biodiversity management of change in the indicator:
Positive effect on biodiversity
Units in which it is expressed:
(e.g. km2, number of individuals, % change)
%, number of sites
Description of source data:
(origins, dates, units, sample size and extent, custodians)
Source data: Cadastre of contaminated sites managed by the Environmental Protection Agency
Calculation procedure:
(include appropriate methods and constraints for aggregation):
The indicator is produced by analysing progress in management of contaminated sites, which is expressed through:
- Total number of potentially contaminated sites,
- Number of sites where preliminary survey was conducted in %,
- Number of sites where detailed surveys were carried out (in %),
- Number of sites where remediation and remediation measures are undertaken,
- Number of sites where remediation was performed (in%),
- Costs and estimated rehabilitation costs (RSD),
- Share of the main types of localized sources of soil pollution in the total number of identified sites (in%),
- Share of industrial branches in localized soil pollution (%),
- Major pollutants affecting soil and surface water.
Most effective forms of presentation:
(graph types, maps, narratives, etc.-give examples where possible):
Number of sites expressed numerically, share expressed in%, remediation and remediation costs expressed in RSD
Limits to usefulness and accuracy:
(e.g. slow change in response to pressures, poor quality data, limited scope for updating)
Limited scope for updating
Updating the indicator:
(How often? What is the process?)
Continuous submission of data, reporting annually in the national State of the Environment Report and Soil State Report.
The Cadastre of Contaminated Sites is a set of data on endangered, polluted and degraded soil and it is an integral part of the Soil Information System maintained by the Environmental Protection Agency.
Data on soil quality in contaminated sites, as well as on pollutants, shall be submitted to the Agency in accordance with the Law on Land Protection.
Closely related indicators
Soil quality
Additional information and comments
The Rulebook on the Content and Manner of Keeping the Cadastre of Contaminated Sites, Type, Content, Forms, Methods and Deadlines for Submission of Data was adopted in August 2019 (Official Gazette of RS No. 58/2019). The Rulebook on the list of activities that may cause soil pollution and degradation, procedure, content of data, deadlines and other requirements for soil monitoring was adopted in September 2019 (Official Gazette of RS No. 68/19).
Table 1: Progress in contaminated sites management
| Locations | Detailed investigated locations | Main site investigation | Site remediation |
| 2007 (375) | 0.5 | 0.5 | 5.7 |
| 2017 (709) | 10.7 | 10.7 | 7.3 |
Table 2: Share of main types of localised sources of soil pollution
| Industrial and commercial activites | Municipal waste disposal | Industrial waste disposal | Mining sites | Oil Industry | Power plants | Military sites | Storage | Transport spills on land | Other |
| 16.3 | 43.7 | 8.3 | 1.3 | 26.4 | 3.5 | 0.0 | 0.0 | 0.5 | 0.0 |
Serbia