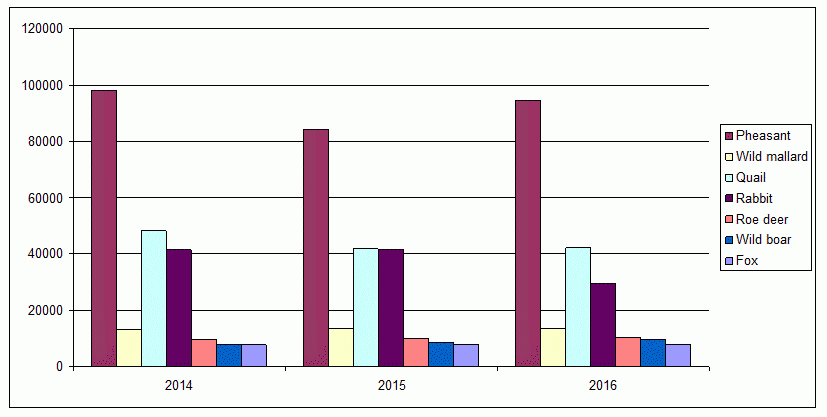
Key message: There was small difference in the size of the population of the main hunting species
Assessment: The indicator shows the size of populations of the selected main game species in the Republic of Serbia: roe deer, wild boar, rabbit, pheasant. Institute for Nature Conservation of Serbia collects data on population status of grey wolf, brown bear and lynx. According to data of the Forests Directorate, authority in charge of hunting in Serbia, there were slight differences in size of populations of the main hunting species registered. Rabbit and roe deer populations decreased during the hunting year 2015/2016 (by 10% approximately). Pheasant population size increased by around 1% and wild boar population around 5%. In the same period, the amount of large game caught (roe deer, wild boar, fallow deer) increased, while the amount of small game caught (pheasant, rabbit) reduced. At annual level, about 7,800 foxes and 170-180 wolves and 35 musc oxen were killed.


Indicator Name: Population dynamics of the main hunting species
Institution/Author: Environmental Protection Agency/Slaviša Popović
Use and interpretation:
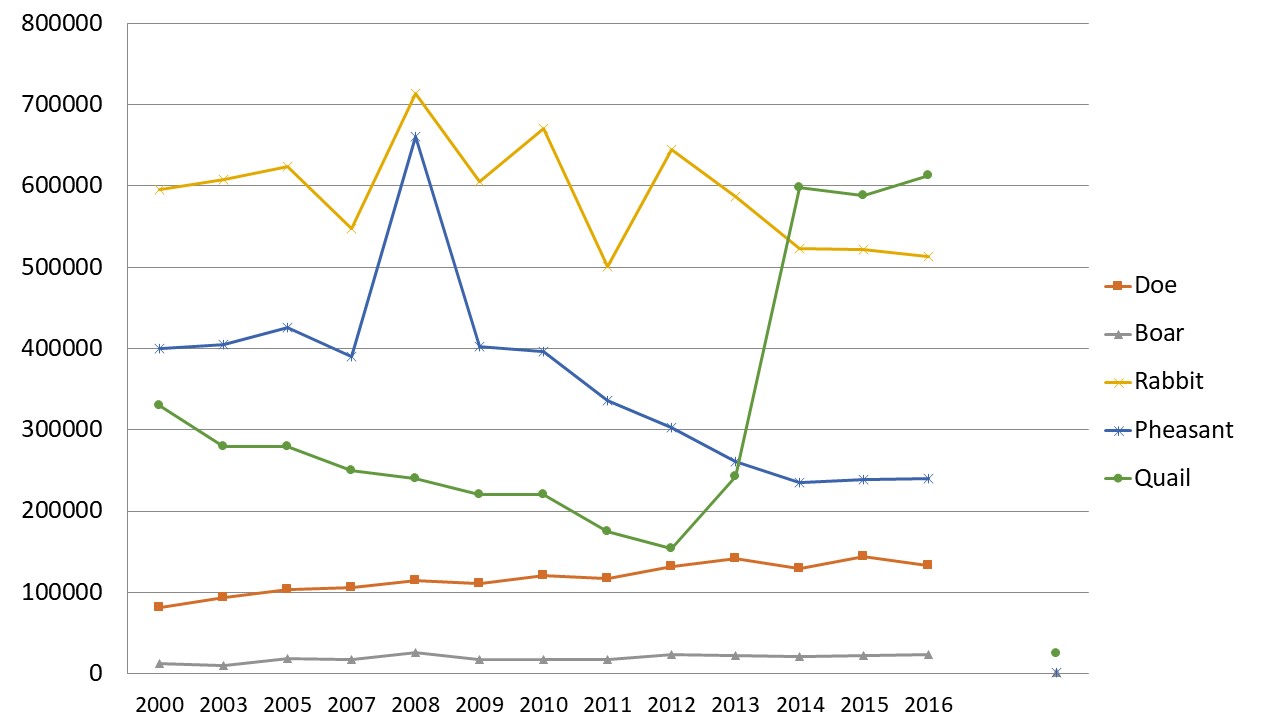
The indicator shows the size of populations of the selected main hunting species in the Republic of Serbia: doe, boar, rabbit, pheasant, quail.
Key question(s) which indicator helps to answer
The indicator helps to answer the question: How does it look dynamic of populations of the main hunting species?
Use of indicator
Forest Directorate of the Ministry of agriculture collects data regarding population dynamics of the main hunting species: doe, boar, rabbit, pheasant, quail. Institute for Nature Protection collects data regarding wolf, bear and lynx.
Scale of appropriate use
According to the Forests Directorate Data, there were slightly differences according to the size of populations of the main hunting species registered. Rabbit and doe populations decreased during the hunting year 2015/2016 (by 10% approximately). Pheasant population size increased by around 1%. Quail population size increased by around 4%, and boar population about 5%.
Potential for aggregation:
Meaning of upward or downward trends (“good or bad”)
It is evidenced that rabbit, pheasant, boar populations have been decreasing, while doe and quail populations have been increasing.
According to the data of the Forest Directorate, the size of wolf population is estimated at 2,032 specimens, bear population at 91, lynx population at 20, and beaver population at 15.
According to the data of the Institute for Nature Conservation, the size of wolf population ranges from 500 to 1,400 specimens, the size of bear population did not exceed 53 specimens, population of lynx is reduced to several dozen specimens from the “eastern” sub-species and a couple of specimens of the “western” sub-species.
Possible reasons for upward or downward trends:
According to available data, doe and boar have stable population through the years, while pheasant and rabbit number of populations vary and depend on conditions and hunting quotas.
Implications for biodiversity management of change in the indicator:
The indicator is represented as Biodiversity Indicator in 2015.
Units in which it is expressed:
The indicator is expressed in number of specimens.
Description of source data:
Forest Directorate, Institute for Nature Conservation of Serbia
Calculation procedure:
Number of samples
Most effective forms of presentation:
(graph types, maps, narratives, etc.-give examples where possible):
The best way to present this indicator is a graph.
Limits to usefulness and accuracy:
Delay in data exchanging with responsible Directorate and hunting associations. There are no exact and precious data regarding the size of some hunting population, because of inadequate methodologies applied.
Updating the indicator:
Data are updated annually.
Closely related indicators
Additional information and comments
| Doe | Boar | Rabbit | Pheasant | Quail | |
| 1990 | 106000 | 18500 | 570000 | 620000 | 225000 |
| 1995 | 77000 | 19200 | 580000 | 515000 | 237000 |
| 2000 | 81500 | 12648 | 595484 | 400000 | 330404 |
| 2003 | 94000 | 9600 | 608000 | 405000 | 280000 |
| 2005 | 103725 | 19099 | 623839 | 425299 | 279612 |
| 2007 | 105946 | 18178 | 547693 | 390687 | 250000 |
| 2008 | 114706 | 26701 | 713558 | 660163 | 240000 |
| 2009 | 111000 | 17475 | 606000 | 403000 | 220000 |
| 2010 | 120900 | 17682 | 670915 | 396578 | 221000 |
| 2011 | 117502 | 17865 | 501456 | 335864 | 175155 |
| 2012 | 132327 | 23238 | 644203 | 302474 | 154587 |
| 2013 | 141818 | 22008 | 587108 | 260485 | 243180 |
| 2014 | 129881 | 21568 | 523455 | 234873 | 597820 |
| 2015 | 144149 | 22024 | 521519 | 239045 | 587910 |
| 2016 | 132929 | 23250 | 512991 | 240687 | 612562 |
Serbia