Key message: The share of area under organic production in the utilised agricultural area was 0.5% in 2018
Assessment: The indicator shows increase of the area under organic production.
- The share of area under organic production in the utilised agricultural area was 0.5% in 2018;
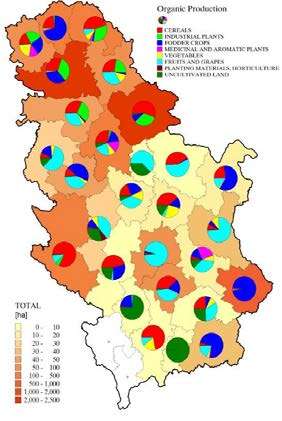
- Of the total area under organic production, the most present are areas under fruit production (43%), followed by cereals (26%) and industrial plants (14.2%).
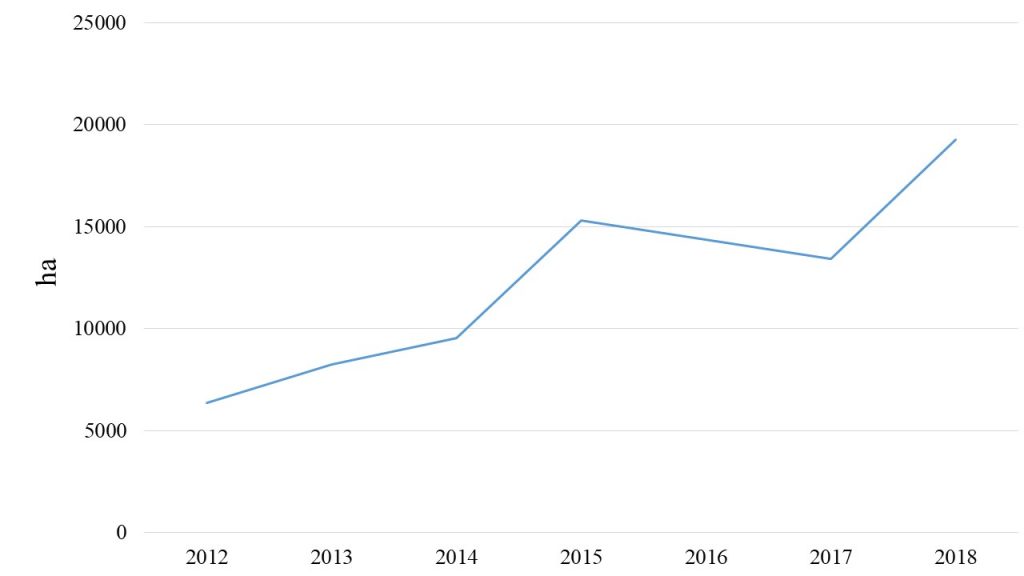
According to data of the Ministry of Agriculture, Forestry and Water Management, the area certified for organic production under crop and vegetable cultures was 145.68 ha in 2007, with the area of 452.81 ha in the conversion period. The area of 5,885 ha was reached in 2010, slightly increased in the period 2013-2017, up to 19,261 ha in 2018, which is 43% more than in 2017.
Based on data on areas under certain categories of crops cultivated according to the organic production principles, the most represented ones in 2018 were those under fruit production (43%), followed by cereals (26%), industrial plants (14.2%) and fodder plants (10%). The cultivation of organic vegetables is at a very low level, practically negligible. The same applies to cultivated medicinal and aromatic plants, as these plants are mostly collected from nature. The share of area under organic production in the utilised agricultural area was 0.5% in 2018.

Indicator Name: Areas under organic production
Institution/Author: Environmental Protection Agency/Dragana Vidojević
Use and interpretation:
The Environmental Protection Agency of Serbia in its annual reports on the state of the environment in the Republic of Serbia and reports on economic potentials and activities relevant to the environment.
Subindicators:
1. Total area under organic production;
2. The share of areas under organic production in the total agricultural area.
Key question(s) which indicator helps to answer
The indicator shows trends in the area under organic production and their share in total agricultural area.
Use of indicator
Agricultural policy monitoring and evaluation of measures for biodiversity conservation and environmental protection in agricultural areas.
Scale of appropriate use
National level
Potential for aggregation:
Meaning of upward or downward trends („good or bad“)
Meaning of upward trend: good.
Possible reasons for upward or downward trends:
– Implementation of measures to support agriculture and rural development and to Increase the contribution of agriculture and forestry to maintaining and enhancing biodiversity.
– Subsidies for organic production
Implications for biodiversity management of change in the indicator:
– Increase of areas under organic production contributes of preservation and improvement of the environment and natural resources.
Units in which it is expressed:
– Hectares (ha)
– Percentages (%)
Description of source data:
Ministry of Agriculture, Forestry and Water Management
Collection periodicity: annually
Calculation procedure:
The indicator is made on the basis of data on the total area under organic production and their share in the total agricultural area and is presented numerically, in tables and in a graph as:
– share of areas where organic production methods are applied in the total agricultural area in %;
– share of agricultural holdings applying organic production methods in relation to the total number of agricultural holdings in %;
– share of incentives allocated for the application and development of organic production methods in the total amount of incentives in %.
Most effective forms of presentation: The best way to represent this indicator is through tables and charts that provide an opportunity to track the progress of this indicator and record the observed trends.
Updating the indicator: The data is updated once a year
Closely related indicators
– High Nature Value (HNV) Farmland indicator
– Data on farmland species
Additional information and comments
The Environmental Protection Agency collects data through the Environmental Information System, as well as through direct cooperation with relevant institutions. According to data from the Ministry of Agriculture, Forestry and Water Management, organic production in 2018 took place on a total area of 19,261 ha, which is 43% more than the area in 2017. Of that, arable land amounted to 13,730 ha, including meadows and pastures on an area of 5,531 ha. The share of area under organic production in relation to the area of utilized agricultural land in the territory of the Republic of Serbia is 0.5%. Of the total area under organic production in 2018, 6,660 ha were in the conversion period, while the area under organic status was 12,661 ha. The trend of growing areas under organic production is noticeable.
The stated number of hectares does not include the areas used for the collection of organic wild berries, mushrooms and medicinal plants, since there is no official methodology in the Republic of Serbia on the basis of which it is possible to obtain data on the total area on which organic wild plant species are harvested from natural habitats.
Of the total arable land under organic production in 2018, fruit production is the most represented with 43%, followed by arable production with 26%, followed by the production of industrial plants with 14.2%, fodder with 10%, while the production of vegetables and medicinal and aromatic plants represented only 1.4% each, while areas under the other category were represented by 4%
Since 2006, following the entry into force of the Organic Production and Organic Products Act and the introduction of incentives for the development of organic production, there has been a steady increase in the number of producers and areas where organic production methods are applied.
Table 1: Areas with organic farming in the period 2011-2017
| Surface (ha) | |||||||||
| 2010 | 2011 | 2012 | 2013 | 2014 | 2015 | 2016 | 2017 | 2018 | |
| Total agriculture area with organic production methods implemented | 5885 | 6335 | 6340 | 8228 | 9548 | 15298,01 | 14358 | 13423,1 | 19261 |
| Number of producers | 137 | 323 | 1061 | 1281 | 1867 | 2289 | 2794 | 6153 | |
Table 2: Organic production by categories of plant crops in 2018
| 2018 | Cereals | Industrial plants | Fodder | Medicinal and aromatic plants | Vegetables | Fruit | Other |
| 26 | 14,2 | 10 | 1,4 | 1,4 | 43 | 4 |