Key message: Area of broadleaved forests has decreased; the area of coniferous forest and transitional shrubs-forest vegetation has increased
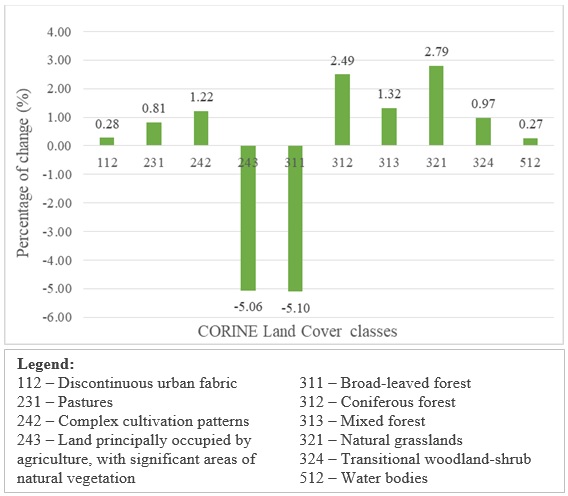
Assessment: Protected Area, Landscape of Extraordinary Characteristic “Vlasina” – considering the fact that no significant anthropogenic pressure was exerted in the area in terms of construction of new artificial structures in the protected area “Vlasina” since 2006, the changes in habitat types in the protected area “Vlasina” are a result of natural regeneration of vegetation (Džoljić, 2017). The most significant result is the state of natural grassland systems in the mountains, which are considered as one of the ecosystems with the largest number of species. Since 2006, the size and number of surfaces of natural grasslands in this area has not changed significantly. After 2006, this type of habitat shows a tendency to expand its surface, which can be seen as a recovery of highland grass surfaces. It should be noted that in 2000, the development of a discontinuous urban area (0.28%) was observed, concentrated on the north coast of the lake. Since 2000, there has been stagnation in the development of artificial surfaces, most likely due to the worsening economic situation in the south of Serbia, so anthropogenic pressure in the following period has remained the same.
The total area of forest ecosystems remains largely unchanged. However, a significant decrease in surfaces under broad-leaved forests, together with increased fragmentation, has been recorded. Also, higher sensitivity of deciduous forests is the result of a change in climate parameters or the exploitation of forest resources. With regard to this, an increase in transitional area of the forest landscape-shrub (0.97%) has also been recorded. Unlike deciduous forests, the areas under coniferous and mixed forests in the mentioned period have increased in surface. The class of agricultural area with significant amount of natural vegetation has notable decrease (5.06%) of its territory. In addition, decrease in habitat polygons number was registered in 2006. The decrease in this class can be partially explained by more intensive agricultural activity e.g. increment of complexes of arable land (1.2%). On the other hand, lower anthropogenic pressure provided suitable conditions for natural succession and also for increase number of natural grassland (2.79%). In the analysed period, regeneration of high mountain natural grassland has occurred.
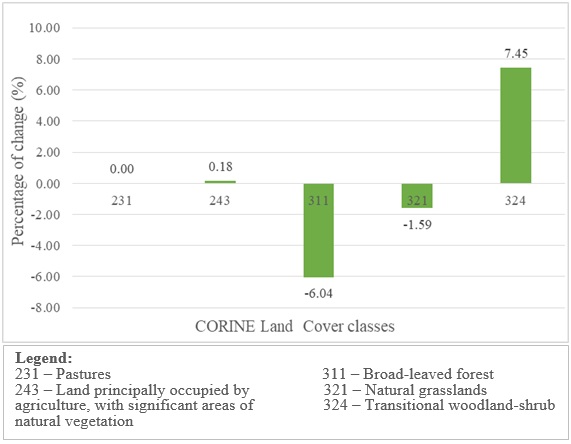
In the territory of the protected area “Dolina Pčinje” in 2000, the phenomenon of pasture class (0.12%), whose area slightly increased in 2012, was recorded (0.13%), and in 2018 the class of pasture was not recorded. Possible reasons for this may be either the abandonment of villages, as a result of which these areas are subject to natural succession, or their conversion to agricultural land, or changes in local climatic conditions. Negative demographic data indicate a decrease in the number of inhabitants in the villages, or even the extinction of villages in this area, but the pressure on resources and biodiversity is not decreasing (Džoljić, 2017). The analysis of data showed the trend of increasing the area under the class of predominantly agricultural land with a significant area under natural vegetation (0.18%), followed by a minimal increase in the number of these territories in 2000. The change of habitat types in the territory of the region of exceptional characteristics “Dolina Pčinje” in the period from 1990 to 2018 is shown in the graph below and in table below. It is interesting to note that all changes detected in this area can be related to anthropogenic pressures.
In the analysed period, a significant decrease by 6.04% in areas under deciduous forests was recorded, mainly as a result of the transition of forest area/shrubs, which increased by as much as 7.45%. Changes in the area of deciduous forests can be associated with increased anthropogenic pressure, accompanied by higher fragmentation of forests. South of Serbia represents an economically 80 underdeveloped area, which is why there is an increased negative anthropogenic effect on biodiversity. In particular, this refers to forest ecosystems, since the dominant way of heating the households in this area is by firing wood during the winter period. Beech forests, dominating in this area, are particularly vulnerable. As an additional pressure, the change of climatic parameters of the last two decades can also be highlighted, which undoubtedly influences the increase of forest ecosystems sensitivity. It should be added that in the period of 2012-2014 the upward trend of defoliation of deciduous trees on the territory of protected area “Dolina Pčinje” was observed and rated from weak to moderate. The area of natural grasslands has been reduced by 1.59%, which can be partly explained by their conversion into agricultural land. The largest decrease in the area with greater fragmentation of the habitat was recorded in 2018. The area of protected site “Dolina Pčinje” shows clear consequences of negative anthropogenic activities, which can be monitored as an increase in the number of classes while simultaneously reducing the area of different types of habitat. Forest ecosystems in this area are additionally endangered, since they also represent a potential target of forest theft.
Indicator Name: Habitat changes in selected protected areas
Institution/Author: The Academy of Applied Technical and Preschool Studies – Department Vranje, Serbia/dr Jovana Džoljić; Environmental Protection Agency/Slaviša Popović
Use and interpretation:
The indicator provides information about relative changes of CORINE land cover (CLC) habitat types in protected areas in Serbia. Results of vegetation cover changes are related to the efficiency of applied management mode and allow stakeholders to plan and direct conservation measures inside the site. Analysis of the monitoring results together with understanding the changes that occurred, provide valuable information that could help to identify future threats to the site.
The interpretation of indicator predominantly depends on a habitat type (CLC class). Noticed area increment or upward trend in classes of Forest and semi-natural areas (Class 3) and Wetlands (Class 4) shows, in general, habitat regeneration and recovery. Downwards trends or decrement in size of one of aforementioned classes show that there are some enhanced pressure (e.g. overexploitation), or some other activity that have negative effect at the site. Regarding the Class 1 (Artificial Surface) and Class 2 (Agricultural Areas), upwards trends can be interpreted as increase of anthropogenic pressure, or as degradation of natural values of protected areas and vice versa.
Key question(s) which indicator helps to answer
Did changes of habitat types in protected areas occur? What is quantitative change of habitat types in protected area? Is Did habitat fragmentation occurred and in what class?
Use of indicator
The indicator shows changes of habitat types (Popović & Džoljić, 2016) in protected areas. The stakeholders can use it to validate effectiveness of conducted conservational measures and activities, as well as to plan future activities for biodiversity conservation.
Results of the monitoring of habitat changes provide valuable data and information to biologists and ecologists as a starting point for future research.
National institutions related to the protected areas (Institute for Nature Conservation of Serbia, Provincial Institute for Nature Conservation, Serbian Environmental Protection Agency, institutions dealing with forest management, etc.) could use information about the trends of habitat changes for planning the future activities.
Scale of appropriate use
Regional and National level.
Potential for aggregation:
Change analysis of CLC habitat types vary among the protected areas.
Meaning of upward or downward trends (“good or bad”)
Trends changes of CORINE Land cover habitat types, upward or downward, depend on a habitat type, and represent positive or negative effects of activities conducted at the site.
Possible reasons for upward or downward trends:
Both the upward trend and increment of CLC habitat type size depend on a type of class. In some classes, it can occur as a result of natural succession, regeneration and expansion of habitat, while in some classes it indicates results of anthropogenic pressure. It also shows the effectiveness of the implemented conservation measures.
The downward trend, regarding the CLC habitat type, is mainly related to an increase in anthropogenic pressure to the site, due to overexploitation of resource (e.g. deforestation[1]). Pressures that occur are not just results of anthropogenic activity. Natural disasters related to climate change, like wildfires, wind etc. can also have negative effect on a fragile ecosystems.
Implications for biodiversity management of change in the indicator:
The indicator is created due to necessity of creating Report to Convention on Biological Diversity.
Units in which it is expressed:
Changes in vegetation cover (CLC classes) are expressed as percentage of PA. Regarding the fragmentation, number of identified polygons is used.
Description of source data:
European Environment Agency, Serbian Environmental Protection Agency.
Calculation procedure:
According to CORINE Land Cover data, for the particular Protected Area, classes and their size in hectares (ha) were determined, together with number of polygons for the years of 1990, 2000, 2006, 2012 and 2018 using QGIS software. Percentage of change detection in each class is different and implies effects on PA.
Most effective forms of presentation:
The best way to present this indicator are graphs which helps to monitor trend-changes of CLC classes. In combination with narratives can be very helpful in explanation of possible reasons of changes.
Limits to usefulness and accuracy:
Smaller changes in vegetation cover, less than 25 ha regarding the Corine Land Cover methodology, cannot be identified. This does not mean they did not occur.
Updating the indicator:
The indicator should be updated every 6 years, with coming-out new CLC map of Europe.
Closely related indicators
Forest area as a proportion of total land area, Habitat changes in UNESCO MAB biosphere reserves, CORINE Land Cover habitat changes in Protected Area in Serbia
Additional information and comments
The analysis should be conducted for the bigger protected areas, first of all, to categories of National and Nature Parks etc.
References:
Džoljić, J. (2017). Savremene metode praćenja radionuklida i ostalih parametara stanja životne sredine u funkciji optimalnog upravljanja zaštićenim područjima Pčinjskog okruga. Doktorska disertacija. Fakultet za ekologiju i zaštitu životne sredine, Univerzitet „Union-Nikola Tesla”, Beograd, Srbija. Retrieved from: http://nardus.mpn.gov.rs/handle/123456789/9121
Popović, S., & Džoljić, J. (2016). Serbian Forest Indicators by CORINE Land Cover. Saarbucken, Germany: LAP LAMBERT Academic Publishing. Retrieved from http://www.sepa.gov.rs/download/publikacije/SerbianForestIndicatorsCorineLandCover.pdf
[1] http://www.kt.gov.rs/sr/news/arhiva-vesti/masovna-seca-suma-u-zasticenom-predelu-oko-manastira-prohor-pcinjski/, https://www.infovranjske.rs/2015-05-07/%C5%A1uma-blista-testera-peva.html
Table 1: Habitat changes in selected protected area “Vlasina”
| No. of polygons | 1990 | 2000 | 2006 | 2012 | 2018 | % | 1990 | 2000 | 2006 | 2012 | 2018 | ||
| 112 | 0 | 1 | 1 | 1 | 1 | 112 | 0,00 | 0,28 | 0,28 | 0,28 | 0,28 | 0,28 | |
| 231 | 10 | 10 | 10 | 10 | 10 | 231 | 12,09 | 11,79 | 12,90 | 12,90 | 12,90 | 0,81 | |
| 242 | 0 | 0 | 2 | 2 | 2 | 242 | 0,00 | 0,00 | 1,22 | 1,22 | 1,22 | 1,22 | |
| 243 | 12 | 12 | 4 | 4 | 4 | 243 | 6,57 | 6,30 | 1,51 | 1,51 | 1,51 | -5,06 | |
| 311 | 4 | 6 | 4 | 4 | 5 | 311 | 36,51 | 35,72 | 33,03 | 32,81 | 31,41 | -5,10 | |
| 312 | 1 | 3 | 4 | 4 | 5 | 312 | 0,34 | 0,78 | 2,17 | 2,17 | 2,83 | 2,49 | |
| 313 | 2 | 5 | 5 | 5 | 5 | 313 | 0,82 | 1,97 | 2,13 | 2,13 | 2,13 | 1,32 | |
| 321 | 11 | 13 | 20 | 20 | 20 | 321 | 12,06 | 9,55 | 14,19 | 14,19 | 14,86 | 2,79 | |
| 324 | 12 | 15 | 21 | 22 | 24 | 324 | 20,70 | 22,68 | 20,79 | 21,00 | 21,67 | 0,97 | |
| 512 | 1 | 1 | 1 | 1 | 1 | 512 | 10,92 | 10,93 | 11,79 | 11,78 | 11,19 | 0,27 |
Table 2: Habitat changes in selected protected area “Pčinja”
| No. of polygons | 1990 | 2000 | 2006 | 2012 | 2018 | % | 1990 | 2000 | 2006 | 2012 | 2018 | ||
| 231 | 0 | 1 | 1 | 1 | 0 | 231 | 0,00 | 0,12 | 0,12 | 0,13 | 0,00 | 0,00 | |
| 243 | 3 | 4 | 4 | 4 | 4 | 243 | 4,26 | 4,37 | 4,41 | 4,41 | 4,44 | 0,18 | |
| 311 | 2 | 1 | 1 | 3 | 3 | 311 | 68,79 | 63,41 | 63,42 | 63,45 | 62,75 | -6,04 | |
| 321 | 4 | 2 | 3 | 3 | 6 | 321 | 10,32 | 10,15 | 10,17 | 10,14 | 8,73 | -1,59 | |
| 324 | 5 | 5 | 6 | 6 | 6 | 324 | 16,63 | 21,94 | 21,88 | 21,87 | 24,08 | 7,45 |
Serbia