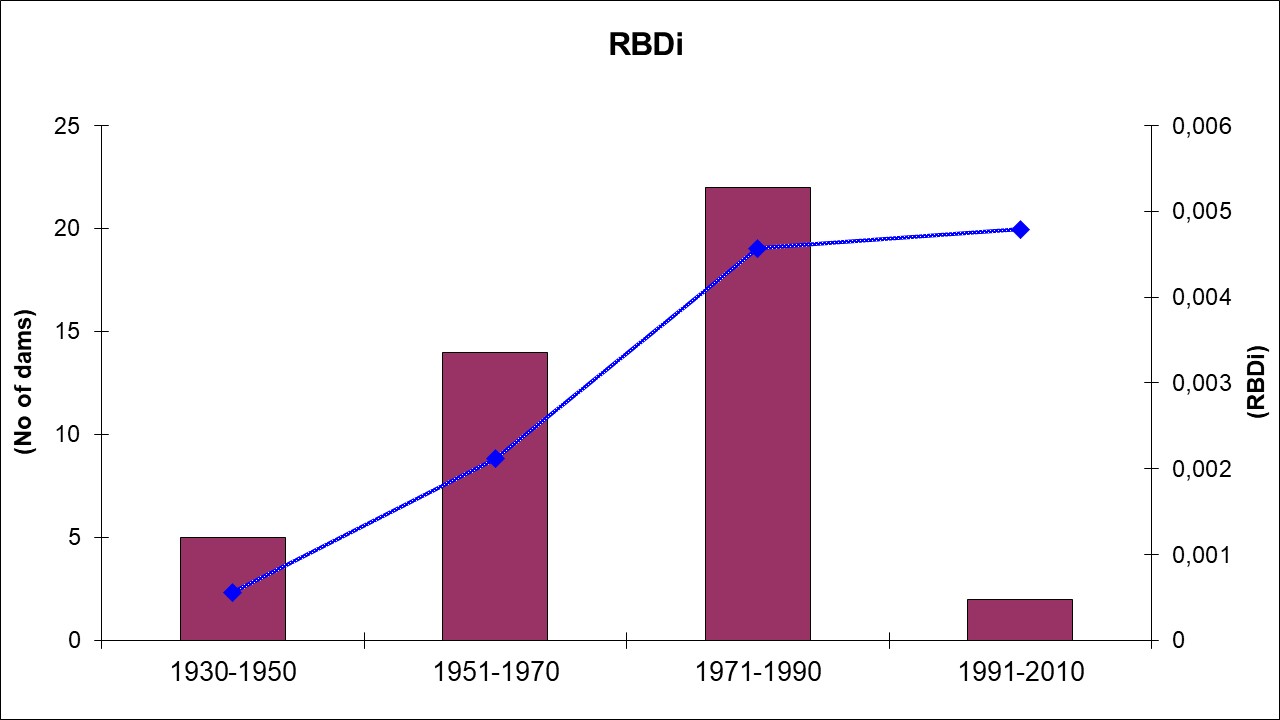
Key message: The index of river fragmentation by dams increased in the period 1930-2010
Assessment: The indicator is used to show relation between the length of all rivers in Serbia and number of dams in the rivers. The SELAR database collects information about total number of dams in the rivers in Serbia in order to calculate Fragmentation index. The Fragmentation index in Serbia shows significant increase since 1930, and it has a big impact on fish biodiversity in the rivers. The Fragmentation index of river habitats shows relation between the length of all rivers in Serbia and number of dams in the rivers. The total length of all rivers is about 8,972 km, and the total number of dams is 170, according to the SELAR database until 2010. Fragmentation index in Serbia is 0.01895 with significant increase since 1930. Based on data for 43 dams with the existing data on the year of construction, it may be noted that Fragmentation index increased in the period 1930-2010. The largest numbers of dams are up to 20 m high, while 5 dams are about 100 m high.
Indicator Name: Fragmentation of the river habitats
Institution/Author: Environmental Protection Agency/Slaviša Popović
Use and interpretation:
The indicator represents a relation between the length of all rivers and number of dams in the rivers. Effects of dams on biodiversity are monitored by dynamic of the fish population or fish catch.
Key question(s) which indicator helps to answer
The indicator helps to answer the question: What are the effects of dam on biodiversity?
Use of indicator
The indicator is used to show relation between the length of all rivers in Serbia and number of dams in the rivers. SELAR database collects information about total number of dams in the rivers in Serbia in order to calculate the Fragmentation index. The Fragmentation index in Serbia shows significant increasing since 1930, and has a big impact on fish biodiversity in the rivers.
Scale of appropriate use
Average catch of fish before and after building dams. Number of dams and in correlation with the Fragmentation index.
Potential for aggregation:
Meaning of upward or downward trends (“good or bad”)
The Fragmentation index of river habitats shows relation between the length of all rivers in Serbia and number of dams in the rivers. The total length of all rivers is about 8,972 km, and the total number of dams is 170, according to SELAR database until 2010. Fragmentation index in Serbia is 0.01895 with significant increase since 1930. Based on data for 43 dams with the existing data on the year of construction, it may be noted that Fragmentation index increased in the period 1930-2010. The largest numbers of dams are with up to 20 m high, while 5 dams are about 100 m high.
Possible reasons for upward or downward trends:
There are data on fish catch of Acipenseridae species, and eel is observed as an effect of 2 dams building in Danube, data provided by the Republic Statistical Office. After the construction of Iron Gate 1 (1970) catch of eel has not been registered. Catch of Stellat sturgeon significantly decreased after the construction of Iron Gate 1 and almost disappeared after Iron Gate 2 (1984). Catch of Sturgeon and Beluga increased after the construction of Iron Gate 1, but significantly decreased after the construction of Iron Gate 2. Fish catch of Acipenseridae species had been registered until 2002, when Serbia ratified CITES Convention. Since 2009, almost all Acipenseridae species have been under protection, and catch is forbidden.
Implications for biodiversity management of change in the indicator:
The indicator is described as biodiversity indicator by the Serbian Environmental Protection Agency.
Units in which it is expressed:
Total number of dams. Length of rivers in km. Average catch of fishes in kg.
Description of source data:
Republic Statistical Office
Calculation procedure:
The indicator is calculated as correlation between the length of all rivers and number of dams in the rivers. Fish catch is expressed in numbers of fishes or kilograms.
Most effective forms of presentation:
(graph types, maps, narratives, etc.- give examples where possible):
The best ways to present this indicator is graph.
Limits to usefulness and accuracy:
Lack of updated data
Updating the indicator:
Statistical data are updating annually.
Closely related indicators
Additional information and comments
Table: Fragmentation of the river habitats
| 1930-1950 | 1951-1970 | 1971-1990 | 1991-2010 |
| 5 | 14 | 22 | 2 |
| 0,00056 | 0,00212 | 0,00457 | 0,00479 |
Serbia