Key message: Since 2007 number of dead trees increase 5 times
Assessment: The indicator shows the connection between climate parameters and forest trees health condition (dead wood) registered by the Institute for Meteorology and International Cooperation Programme (ICP) Forest Monitoring Network. Correlation between dried trees and strongly defoliated trees for 4 dominant species (Beech, Hungarian oak, Turkish oak and Spruce) showed strong dependence on temperature.
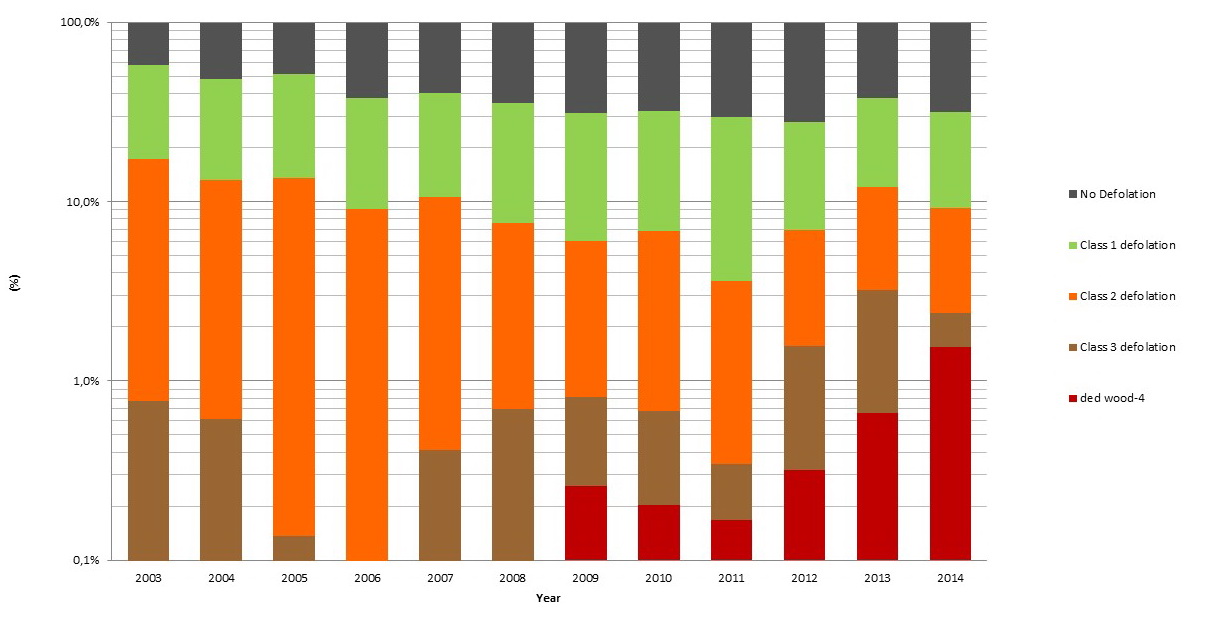
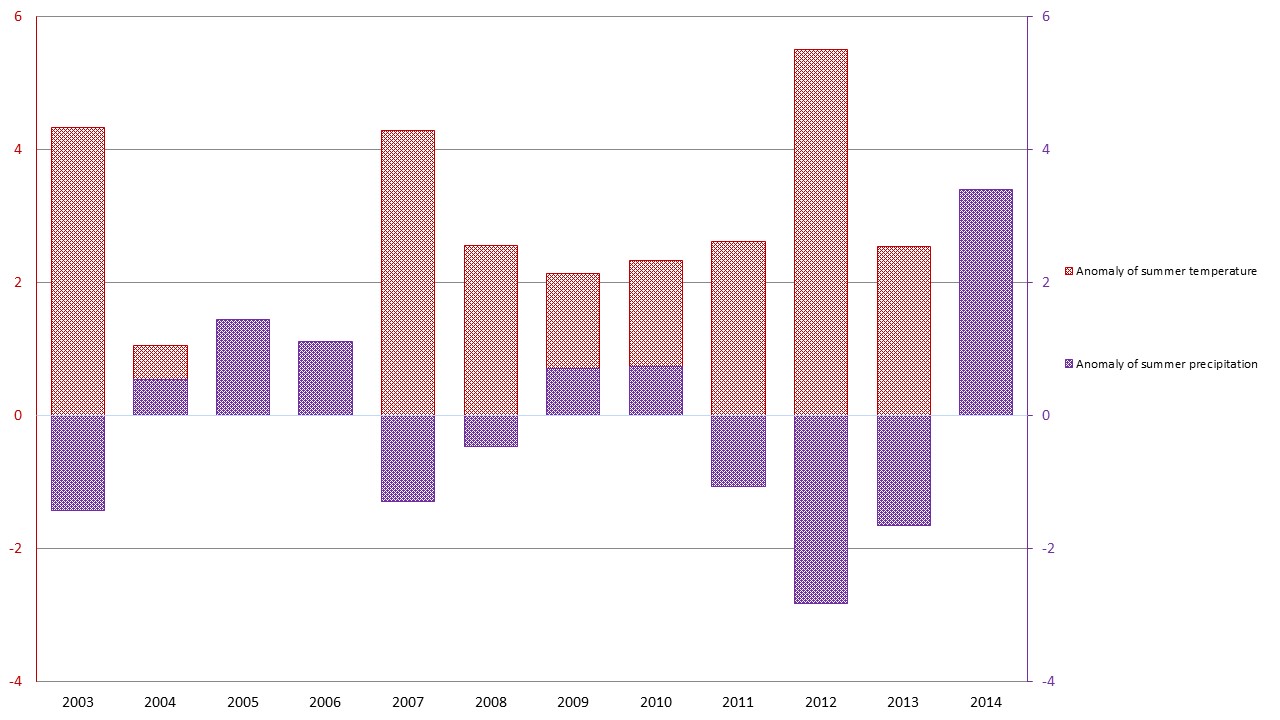
There were 52 precipitation anomalies during the summer season (June, July and August) – when extremely hot and dry summers were registered. Since 2008, significant increase of dried trees (class 4) and strongly defoliated trees (class 3) for 4 dominant species (beech, Hungarian oak, Turkish oak and spruce) have been registered. Increase of dried trees during 2014 was 5 times higher than in 2007. Increase of strongly defoliated trees was 4 times higher during the same period. Correlation between dried trees and strongly defoliated trees for 4 dominant species (beech, Hungarian oak, Turkish oak and spruce) have been observed. This was connected with temperature and precipitation anomalies during the summer season (June, July and August) when extremely hot and dry summers were registered. Percentage of “none”, “slight”, “average”, “strong” and “dead wood” per year, in accordance with climate parameters; temperature and precipitations were presented. Calculation procedure has been applied according to the criteria of ICP forests monitoring.
Picture 1: Defoliation of forest trees

Picture 2: Temperature and precipitation anomalies for summer season (June, July and August)

Indicator Name: Dead wood and climate changes
Institution/Author: Environmental Protection Agency/Slaviša Popović, Institute for meteorology, University of Belgrade/dr Vladimir Đurđević
Use and interpretation:
The indicator shows the connection between climate parameters and forest trees health condition (dead wood) registered by the Institute for Meteorology and ICP Forest Monitoring Network.
Key question(s) which indicator helps to answer
The indicator helps to answer the question: What is connection between climate parameters and forest trees health condition?
Use of indicator
Correlation between dried trees and strongly defoliated trees for 4 dominant species (Beech, Hungarian oak, Turkish oak and Spruce) have been observed. What was concluded relate to the temperature and precipitation anomalies during the summer season (June, July and August) – when extremely hot and dry summers were registered.
Scale of appropriate use
Since 2008, significant increase of dried trees (class 4) and strongly defoliated trees (class 3) for 4 dominant species (Beech, Hungarian oak, Turkish oak and Spruce) have been registered. Increase of dried trees during 2014 was 5 times higher than in 2007. Increase of strongly defoliated trees was 4 times higher during the same period. Since 2007, temperature and precipitation anomalies for summer season (June, July and August) have brought 6 very or extremely hot and dry summers.
Potential for aggregation:
Meaning of upward or downward trends (“good or bad”)
There was significant correlation among summer temperature and precipitation anomalies and dried trees, which relates mainly to Beech and Hungarian oak, species that are extremely sensitive to climate changes. Turkish oak become sensitive after extreme temperature increase.
Possible reasons for upward or downward trends:
The significant correlation among summer temperature and precipitation anomalies and dried trees, have been registered with one year after extremely dry summer season. Beech and Hungarian oak were extremely sensitive after summer temperature increase, while Turkish oak was sensitive only after extremely hot summer season during 2012.
Implications for biodiversity management of change in the indicator:
The indicator is traditionally described in annual state of the environment reports in Serbia, and it is determined as biodiversity indicator, according to The Rulebook on the National list of environmental protection indicators ( Official Gazette of the Republic of Serbia No. 37/2011).
Units in which it is expressed:
Percentage of “none”, “slight”, “average”, “strong” and “dead wood” per years, in accordance with climate parameters: temperature and precipitations
Description of source data:
Institute for Forestry, Institute for Meteorology, Serbian Environmental Protection Agency
Calculation procedure:
According to the criteria of ICP Forests monitoring.
Most effective forms of presentation:
(graph types, maps, narratives, etc.-give examples where possible):
The best way to present this indicator is a graph.
Limits to usefulness and accuracy:
Additional analyses needed per species
(e.g. slow change in response to pressures, poor quality data, limited scope for updating)
Updating the indicator:
Data are updated annually.
Closely related indicators
Forest health conditions
Additional information and comments
Table 1: Defoliation of forest trees
Table 2 and 3: Temperature and precipitation anomalies for summer season (June, July and August)

Serbia