Key message: Afforestation process inside protected areas increase
Assessment: Habitat changes inside protected areas show increase of forests (classes 311, 312 and 313), and semi-forested areas (243 and 324). All types of forests have increased, especially coniferous and mixed forests. At the same time, an increase of polygons number has been registered, except for mixed forests. Although there is an increase in forested areas in the protected sites, at the same time, there is fragmentation of forests increase, except for mixed forest. The pastures and natural grasslands (classes 231 and 321) have undergone different changes. Increase of pastures area altogether with decrease of fragmentation has been registered. Also, decrease of natural grasslands altogether with increase of fragmentation has been registered.
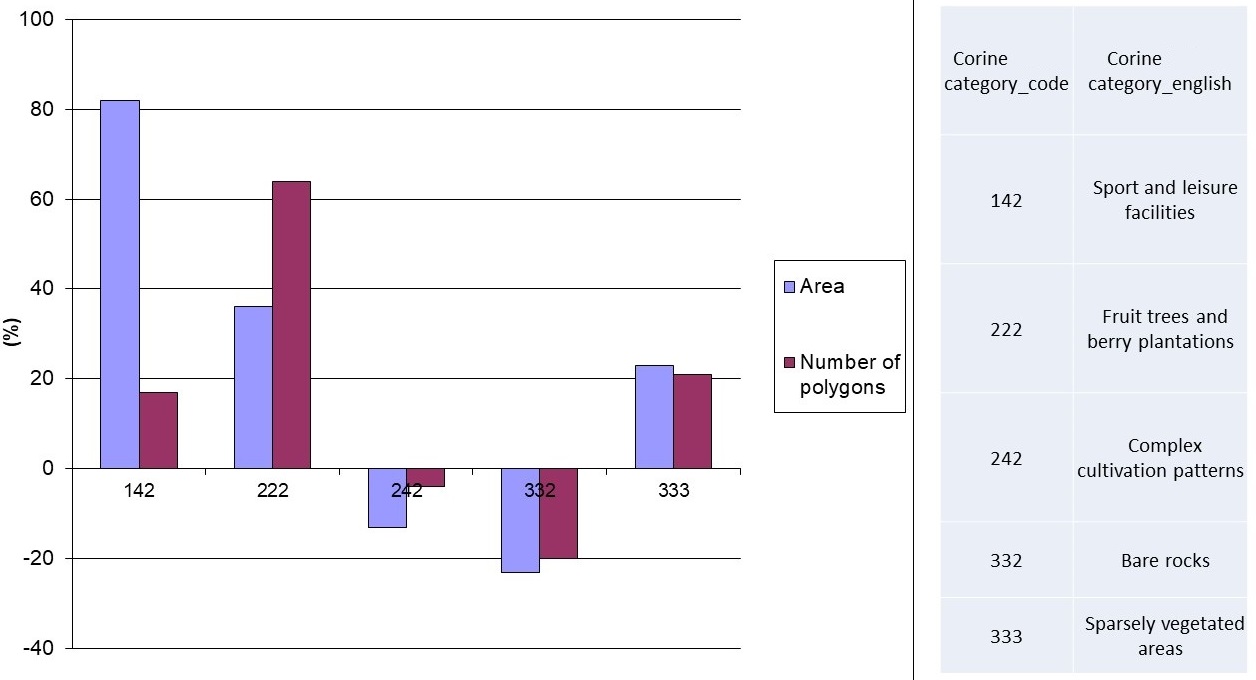
The main increase (80%) is registered in class 142, sport and leisure facilities. Class of fruit trees and berry plantations also have significantly increased (36%). Other agricultural landscapes do not show significant changes, except for the decrease of complex cultivation patterns (13%) altogether with decrease of fragmentation. Significant result is registered inside the class of bare rocks (class 332) with 23% decrease altogether with 20% decrease of fragmentation, and inside class of sparsely vegetated area (class 333) with 23% of area and 20% of polygons increase.
Increase of forested areas and decrease of non-forested areas have been registered inside the protected areas, in the period 2012-2018.

Indicator Name: Land Cover habitat changes in Protected Area in Serbia
Institution/Author: Environmental Protection Agency/Slaviša Popović, Nemanja Jevtić
Use and interpretation:
The indicator defines trends in the change of intended use of agricultural, forest and other semi-natural and natural land into urban land and other artificial surfaces.
Key question(s) which indicator helps to answer
The indicator helps to answer the question: How intensive is change of land use?
Use of indicator
The indicator shows surfaces occupied by construction activities and urban infrastructure, as well as urban green areas, sports and recreation surfaces. The indicator is calculated by analyzing charts based on images of the CLC base Landsat satellite for 2006, 2012 and 2018. The analysis of contributions by specific categories of intended land use for urban development in Serbia in the period 2006-2018 showed which type of land is occupied mostly.
Scale of appropriate use
The indicator is calculated by analyzing maps based on images from Landsat satellites from the CLC database for 2006, 2012 and 2018 and on the basis of the trend of increase in surface area which has been changed in a period of time (5-10 years) and based on CLC-base data changes.
Potential for aggregation:
Meaning of upward or downward trends („good or bad“)
Corine Land Cover database analysis presence of number of classes of CLC nomenclature. By this database dominant surfaces are monitored, in line with the entire territory of the country (agriculture, woods, semi-natural areas, artificial surfaces). Analysis of the change of intended land use in 2006-2018 period shows that most changes occurred under artificial surface category (34605 ha increase). Agricultural land in the observed period reduced by 86492 ha. Surfaces under the category of forests and semi-natural areas increased by 220485 ha, humid regions – classified under inland wetlands – increased by 8487ha, while areas under water basins increased by 17542 ha, mostly as a result of construction of artificial lakes.
Possible reasons for upward or downward trends:
Intensive urbanization and change of land use lead have negative impact on biodiversity, especially in habitats changing. Corine Land Cover database analysis for 2018 shows presence of 30 out of 44 classes of CLC nomenclature. Agricultural surfaces are dominant with 54,6 % of the entire territory of the country. Woods and semi-natural areas cover almost 40 % of the land. Land provided under artificial surfaces covers almost 3,71 % of the territory, and the rest of approximately 1,71 % is classified as humid areas and water basins.
Implications for biodiversity management of change in the indicator:
The indicator is traditionally described in annual state-of-the-environment reports in Serbia, and it is determined as biodiversity indicator, according to The Rulebook on the National list of environmental protection indicators (“The Official Gazette of the Republic of Serbia”, No. 37/2011).
Units in which it is expressed:
Hectares or km2
Description of source data:
Environmental Protection Agency
Calculation procedure:
The indicator is displayed numerically, by tables and graphs in ha of changed lands, according to the type of changes and proportion (in %) of changed lands compared to total land. Changes in agricultural, forest and seminatral / natural soil (CLC2 to CLC5) in the urban areas (CLC1) are grouped depending on the methodology for calculation of the soil cover
Most effective forms of presentation:
(graph types, maps, narratives,etc.-give examples where possible):
The best ways to present this indicator are graphs and tables.
Limits to userfelness and accuracy:
Precision of data relative to the surface to be monitored
Updating the indicator:
Every 6 years
Closely related indicators
Table 1: CORINE Land Cover habitat changes in Protected Area in Serbia
| Corine category_code | Corine category_english | Surface (ha) 2012 | Surface (ha) 2018 | No of polygons 2012 | No of polygons 2018 | |
| 112 | Discontinuous urban fabric | 859,75 | 969,21 | 251 | 287 | |
| 121 | Industrial or commercial units | 182,32 | 183,06 | 30 | 33 | |
| 122 | Road and rail networks and associated land | 59,41 | 3,73 | 10 | 5 | |
| 131 | Mineral extraction sites | 204,60 | 206,38 | 8 | 11 | |
| 133 | Construction sites | 33,72 | 28,29 | 6 | 2 | |
| 141 | Green urban areas | 632,12 | 627,47 | 16 | 20 | |
| 142 | Sport and leisure facilities | 193,76 | 353,31 | 24 | 28 | |
| 211 | Non-irrigated arable land | 9.108,38 | 8.936,43 | 1.032 | 1.058 | |
| 221 | Vineyards | 179,97 | 123,06 | 23 | 21 | |
| 222 | Fruit trees and berry plantations | 174,24 | 235,83 | 28 | 46 | |
| 231 | Pastures | 17.660,38 | 17.906,14 | 386 | 388 | |
| 242 | Complex cultivation patterns | 22.490,46 | 19.552,80 | 860 | 829 | |
| 243 | Land principally occupied by agriculture, with significant areas of natural vegetation | 36.939,82 | 37.428,43 | 1.182 | 1.223 | |
| 311 | Broad-leaved forest | 288.780,22 | 288.967,79 | 1.091 | 1.207 | |
| 312 | Coniferous forest | 31.265,80 | 32.585,52 | 292 | 322 | |
| 313 | Mixed forest | 50.924,92 | 54.820,21 | 429 | 388 | |
| 321 | Natural grasslands | 52.111,93 | 51.123,13 | 541 | 549 | |
| 1.038,01 | 5 | |||||
| 67,34 | 1 | |||||
| 324 | Transitional woodland-shrub | 99.378,83 | 100.147,40 | 1.313 | 1.351 | |
| 332 | Bare rocks | 156,14 | 119,67 | 5 | 4 | |
| 333 | Sparsely vegetated areas | 4.566,85 | 5.607,00 | 67 | 81 | |
| 334 | Burnt areas | 231,51 | 230,98 | 1 | 1 | |
| 411 | Inland marshes | 7.892,48 | 7.868,08 | 113 | 121 | |
| 511 | Water courses | 11.100,57 | 12.949,40 | 131 | 153 | |
| 512 | Water bodies | 7.163,15 | 7.000,27 | 51 | 60 | |
| 642.291,00 | 649.078,98 | 7.890 | 8.194 |