Key message: There is a decrease in agricultural land in the period 2006-2018
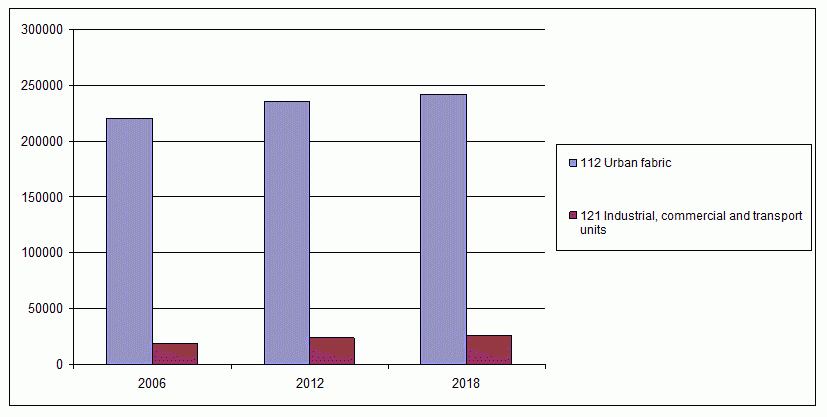
Assessment: The indicator shows surfaces occupied by construction activities and urban infrastructure, as well as urban green areas, sports and recreation surfaces. The indicator is calculated by analysing charts based on images of the CLC base Landsat satellite for 2006, 2012 and 2018. The analysis of contributions by specific categories of intended land use for urban development in Serbia in the period 2006-2018 showed which type of land is occupied mostly. Analysis of the change of intended land use in 2006-2018 period shows that most changes occurred under artificial surface category (34,605 ha increase). Agricultural land in the observed period reduced by 86,492 ha. Surfaces under the category of forests and semi-natural areas increased by 220,485 ha, humid regions – classified under inland wetlands – increased by 8,487 ha, while areas under water basins increased by 17,542 ha, mostly as a result of construction of artificial lakes.


Indicator Name: CORINE Land Cover Change of intended land use
Institution/Author: Environmental Protection Agency/Slaviša Popović
Use and interpretation:
The indicator defines trends in the change of intended use of agricultural, forest and other semi-natural and natural land into urban land and other artificial surfaces.
Key question(s) which indicator helps to answer
The indicator helps to answer the question: How intensive is the change of land use?
Use of indicator
The indicator shows surfaces occupied by construction activities and urban infrastructure, as well as urban green areas, sports and recreation surfaces. The indicator is calculated by analysing charts based on images of the CLC base Landsat satellite for 2006, 2012 and 2018. The analysis of contributions by specific categories of intended land use for urban development in Serbia in the period 2006-2018 showed which type of land is occupied mostly.
Scale of appropriate use
The indicator is calculated by analysing maps based on images from Landsat satellites from the CLC database for 2006, 2012 and 2018 and on the basis of the trend of increase in surface area which has been changed in a period of time (5-10 years) and based on CLC-base data changes.
Potential for aggregation:
Meaning of upward or downward trends (“good or bad”)
The Corine Land Cover database analysis presence of number of classes of CLC nomenclature. By this database dominant surfaces are monitored, in line with the entire territory of the country (agriculture, woods, semi-natural areas, artificial surfaces). Analysis of the change of intended land use in 2006-2018 period shows that most changes occurred under artificial surface category (34,605 ha increase). Agricultural land in the observed period reduced by 86,492 ha. Surfaces under the category of forests and semi-natural areas increased by 220,485 ha, humid regions – classified under inland wetlands – increased by 8,487 ha, while areas under water basins increased by 17,542 ha, mostly as a result of construction of artificial lakes.
Possible reasons for upward or downward trends:
Intensive urbanization and change of land use lead have negative impact on biodiversity, especially in habitats changing. Corine Land Cover database analysis for 2018 shows presence of 30 out of 44 classes of CLC nomenclature. Agricultural surfaces are dominant with 54.6% of the entire territory of the country. Woods and semi-natural areas cover almost 40% of the land. Land provided under artificial surfaces covers almost 3.71% of the territory, and the rest of approximately 1.71% is classified as humid areas and water basins.
Implications for biodiversity management of change in the indicator:
The indicator is traditionally described in annual state-of-the-environment reports in Serbia, and it is determined as biodiversity indicator, according to The Rulebook on the National list of environmental protection indicators (Official Gazette of the Republic of Serbia No. 37/2011).
Units in which it is expressed:
Hectares or km2
Description of source data:
Environmental Protection Agency
Calculation procedure:
The indicator is displayed numerically, by tables and graphs in ha of changed lands, according to the type of changes and proportion (in %) of changed lands compared to total land. Changes in agricultural, forest and seminatural / natural soil (CLC2 to CLC5) in the urban areas (CLC1) are grouped depending on the methodology for calculation of the soil cover
Most effective forms of presentation:
(graph types, maps, narratives, etc.- give examples where possible):
The best ways to present this indicator are graphs and tables.
Limits to usefulness and accuracy:
Precision of data relative to the surface to be monitored
Updating the indicator:
Every 6 years
Closely related indicators
Additional information and comments
Analysis of the change of intended land use in 2006-2018 period shows that most changes occurred under artificial surface category (34,605 ha increase). Agricultural land in the observed period reduced by 86,492 ha. Surfaces under the category of forests and semi-natural areas increased by 220,485 ha, humid regions – classified under inland wetlands – increased by 8,487 ha, while areas under water basins increased by 17,542 ha, mostly as a result of construction of artificial lakes.
Serbia