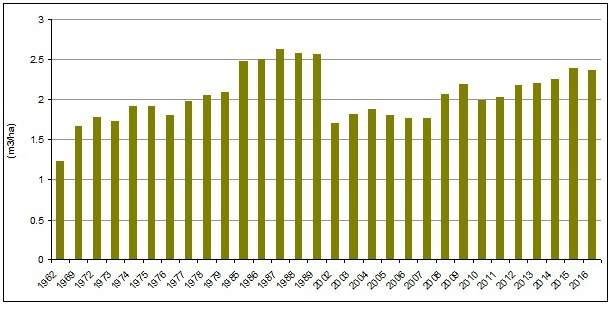
Key message: In the last decade, the production of state-owned forests is increasing
Assessment: The indicator shows trend in production of state-owned forest range of products, the ratio of firewood to industrial wood and trend of share of industrial wood as opposed to firewood. The sold wood products include all wood taken out of the forests, either as logs, wood chops or in another form, and they are sold as timber assortments. The sold timber assortments are an income for owners or users of the forests. Over the last decade, production of state-owned forest range of products increased from 0.7 to 0.92 m3 per hectare of forest around 35% more than in the previous year. In addition, 601 ha of conifer trees (Spruce and Austrian pine) and 949 ha of broadleaved trees (Poplars, oak and acacia) were planted.
It is worth mentioning that such a rate of afforestation is by almost 8,000 – 9,000 hectares lower than in 2007 and in 80s of the last century, when annual afforestation amounted to around 10,000 ha.
Indicator Name: Timber consumption and sale
Institution/Author: Environmental Protection Agency/Slaviša Popović
Use and interpretation:
The Indicator shows the quantity of produced and sold timber assortments.
Key question(s) which indicator helps to answer
The indicator helps to answer the question: What is the quantity of timber consumption in state-owned forests?
Use of indicator
The indicator shows the trend in production of state-owned forest range of products, the ratio of firewood to industrial wood, and trend of share of industrial wood as opposed to firewood. The sold wood products include all wood taken out of the forests, either as logs, wood chops or in another form, and they are sold as timber assortments. The sold timber assortments are an income for owners or users of the forests.
Scale of appropriate use
Over the last decade, production of state-owned forest range of products increased from 0.7 to 0.92 cubic meters per hectare of forest.
The ratio of firewood to industrial wood at a global level was 51.2: 48.8, while in Europe it was 17.8 : 82.2. In Serbia the ratio of firewood to industrial wood was 52 : 48, with the trend of increasing the share of industrial wood as opposed to firewood, which started in 2003.
The scope of works related to timber cut in the Republic of Serbia in 2017, compared to the previous year, increased by 2%. The biggest part of the volume of wood, about 1.6 million m3 (51%), was used as fuel wood. Harvested (gross) of wood volume in state forests is about 2.3 million m3, and in the private forests around 918.000m3.
Potential for aggregation:
Meaning of upward or downward trends (“good or bad”)
The consumption of wood. The indicator shows the intensity of consumption of wood. Using wood instead of non-renewable raw materials is an indicator of a sustainable form of consumption in society. The indicator also relates to the forest assortments produced in state forests, the structure of the products and the amount of sold forestry products. Consumption of firewood is calculated per capita as the volume of wood per capita. Non-wood forest assortments are also calculated in terms of the value and quantity of sales of forestry products that are not wood. Non-wood forest assortments are, for example: meat, fur, fruits and berries, mushrooms, cork, honey, walnuts, hazelnuts …
Possible reasons for upward or downward trends:
Estimates have shown that the consumption of the main wood products (logs, paper, timber) will increase in the next 30 years. The use of solid bio-fuel in power generation can be three times higher by the year 2030. The consumption of logs will have increased by 50% to 75% by the year 2050.
Implications for biodiversity management of change in the indicator:
The indicator is traditionally described in the annual state of the environment reports in Serbia, and it is determined as biodiversity indicator, according to the Rulebook on the National list of environmental protection indicators (Official Gazette of the Republic of Serbia No. 37/2011).
Units in which it is expressed:
In cubic meters (m3) per capita; in cubic meters (m3) or a hectare (ha) for wood assortments manufactured in state managed forest and consumption of fuel wood per capita; in kilograms (kg), pieces, or the national currency / kilogram (RSD / kg) for forest assortments that are not wood.
Description of source data:
Ministry of Agriculture, Directorate for Forests
Calculation procedure:
The methodology defined by criteria UNECE / FAO. The methodology defined by the Statistical Office.
Most effective forms of presentation:
(graph types, maps, narratives, etc.-give examples where possible):
The best ways to present this indicator are graphs and tables.
Limits to usefulness and accuracy:
The data are obtained by the complete coverage of the reporting units of the Statistical Office. The accuracy of the data can be assessed as satisfactory. Precision depends exclusively on the delivery of data by all forest users.
Updating the indicator:
Annually, per 10 years, depending of National forest inventory
Closely related indicators
Forest management
Additional information and comments
Serbia