Key message: Inland water fish harvesting decrease
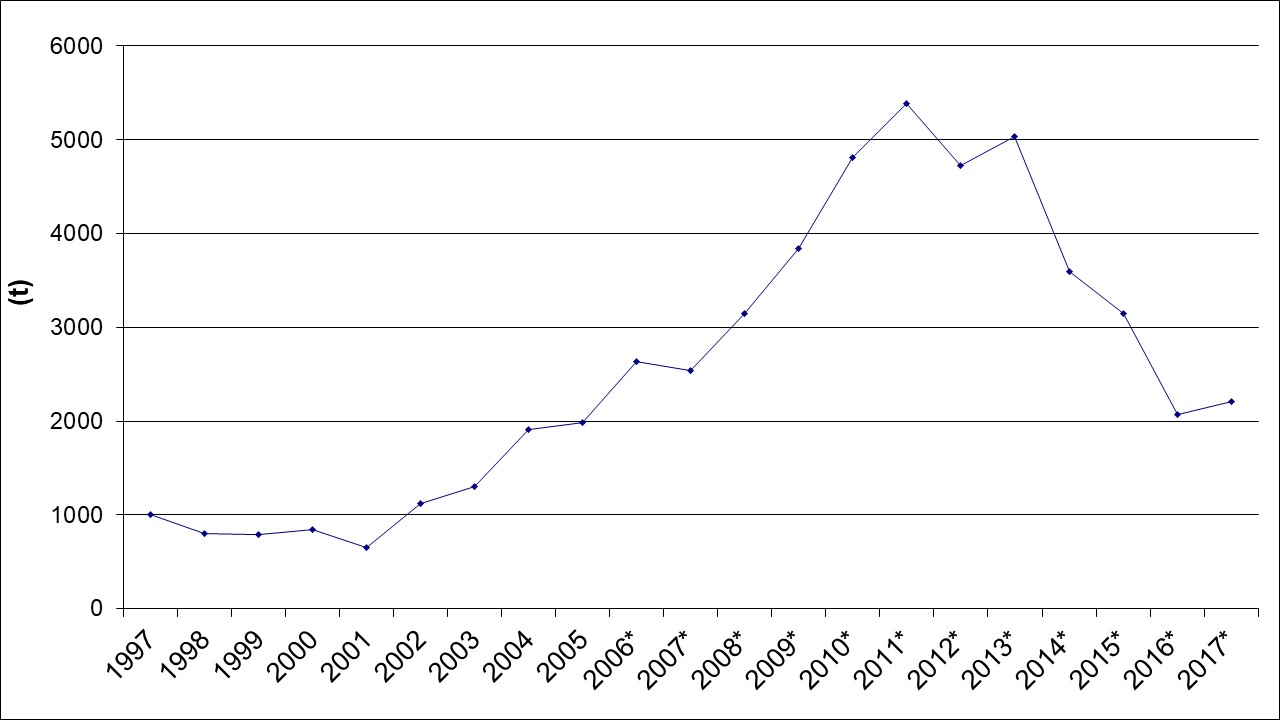
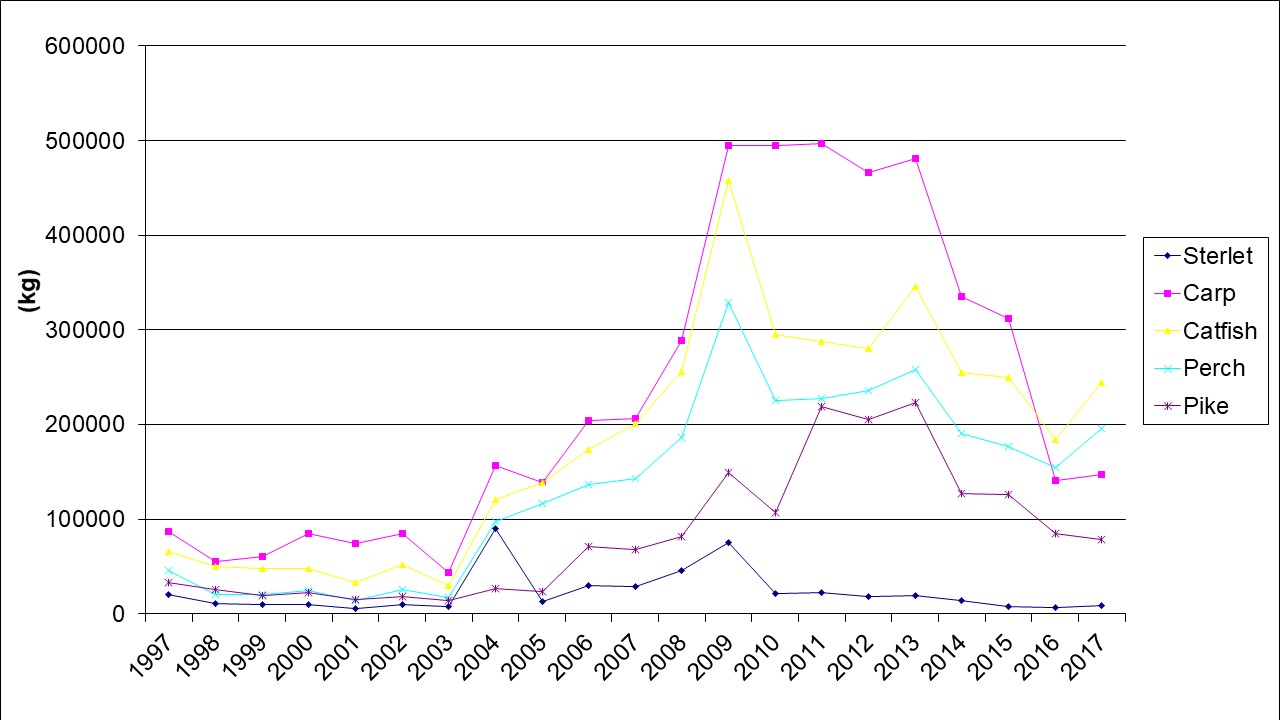
Assessment: During 2018, 2,083 t of fish were caught, which is about 6% less than in 2017. Amount of sterlet caught was reduced by about 35%, carp by about 6%, pikeperch by about 8%, while catches of European catfish increased by about 4% and pike by about 9%. The number of professional fishermen (378) decreased by 20 compared to 2017. The total number of issued recreational fishing permits was 85,426, which is about 4% more than in 2017. The intensity of recreational fishing decreased by about 14%, while the intensity of commercial fishing increased by over 16% compared to 2017.
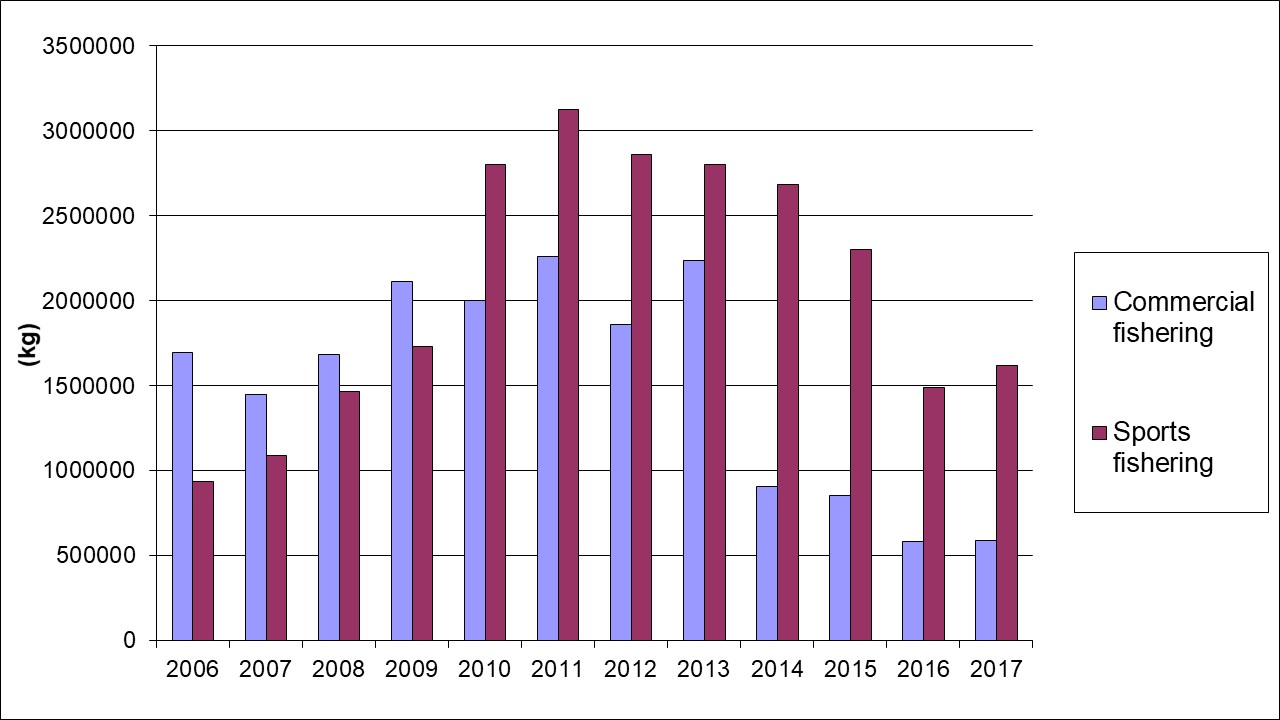
The indicator represents the quantity and structure of caught fish. Quantity of production of organic biomass (primarily fish) in aquatic ecosystems and water quality. The indicator is also used to monitor trend of amount of catches through recreational and commercial fishing. Total amount for recreational fishing increased from 2010, while commercial fishing shows a declining trend.
Indicator Name: Fresh water fishing
Institution/Author: Environmental Protection Agency/Slaviša Popović
Use and interpretation:
The indicator represents the quantity and structure of caught fish. Quantity of production of organic biomass (primarily fish) in aquatic ecosystems and water quality.
Key question(s) which indicator helps to answer
The indicator helps to answer the question: How big is intensity of pressure on freshwater ecosystems caused by fishing?
Use of indicator
The indicator is also used to monitor the trend of volume of fish caught in sports fishing and commercial fishery. Volume is expressed in kilos, and increased from 2010 for sports fishing, while commercial fishery volume shows a declining trend.
Scale of appropriate use
Total freshwater fishing decreased by around 34% in the course of 2016, compared to 2015, while in 2017 slightly increase (7%) was registered. Commercial fishing reduced by almost 50% in 2016 and 2017, compared to 2015, as well as sports fishing, at the same percent.
Potential for aggregation:
Meaning of upward or downward trends (“good or bad”)
During 2017, 2,208 t of fish was caught, which is by 7% more than in 2016. Carp catch was reduced by almost 50% in 2016 and 2017, compared to 2015, catfish catch increased by 10% in 2017 compared to 2016, and perch by 30% in 2017 compared to 2016.
Possible reasons for upward or downward trends:
The total number of issued permits for sports fishing in 2017 was 81,944, which is around 7% more than in 2016. The volume of sports fishing increased by around %, while that of commercial fishing increased around 1.5% in comparison with 2016.
Implications for biodiversity management of change in the indicator:
The indicator is traditionally described in annual state of the environment reports in Serbia, and it is determined as biodiversity indicator, according to the Rulebook on the National list of environmental protection indicators (Official Gazette of the Republic of Serbia No. 37/2011).
Units in which it is expressed:
Biomass index in kg / km and / or kg / ha for fishing species and indicator species. Increase in biomass in kg / km and / or kg / ha for fishing species at annual level.
List of species. Quantity in kilograms (kg) and tons (t).
Description of source data:
Republic statistical office
Calculation procedure:
Based on the data series, the trend followed change of water status and taxonomy biomass. Monitoring methodology and development of fishing grounds are in accordance with the Monitoring Programme of the Rulebook for monitoring the situation of fish stocks in fishing water (Official Gazette of RS No. 71/2010) in accordance with the Law on Fisheries and the best available scientific-professional methodologies.
The amount of fish harvested and produced is given according to the reports of users of fishing areas and according to the questionnaires from Republic Statistical Office. Reports and questionnaires were prepared in accordance with the Rulebook on the manner of keeping fishing records (Official Gazette of the Republic of Serbia No. 104/2009).
Most effective forms of presentation:
(graph types, maps, narratives, etc.-give examples where possible):
The best ways to present this indicator are graphs.
Limits to usefulness and accuracy:
Limited scope for updating
Updating the indicator:
Data are updated annually.
Closely related indicators
Fresh water species
Additional information and comments
Table 1: Amount of commercial and sports fishering (kg)
| Commercial fishering | Sports fishering | |
| 2006 | 1694924 | 936130 |
| 2007 | 1447403 | 1088148 |
| 2008 | 1682923 | 1468080 |
| 2009 | 2112229 | 1732443 |
| 2010 | 2001915 | 2804914 |
| 2011 | 2259990 | 3124229 |
| 2012 | 1862269 | 2859055 |
| 2013 | 2234979 | 2804978 |
| 2014 | 908000 | 2683000 |
| 2015 | 851000 | 2299000 |
| 2016 | 581034 | 1487845 |
| 2017 | 589517 | 1618339 |
Table 2: Fresh water fishing total catches (kg)
| 1997 | 998 |
| 1998 | 803 |
| 1999 | 789 |
| 2000 | 838 |
| 2001 | 646 |
| 2002 | 1119 |
| 2003 | 1301 |
| 2004 | 1910 |
| 2005 | 1988 |
| 2006* | 2631 |
| 2007* | 2536 |
| 2008* | 3151 |
| 2009* | 3845 |
| 2010* | 4807 |
| 2011* | 5384 |
| 2012* | 4721 |
| 2013* | 5040 |
| 2014* | 3591 |
| 2015* | 3150 |
| 2016* | 2069 |
| 2017* | 2208 |
Table 3: Structure of fresh water catches by species
| Sterlet | Carp | Catfish | Perch | Pike | Tench | |
| 1997 | 20783 | 86508 | 65574 | 45351 | 32878 | 1874 |
| 1998 | 10805 | 54820 | 49517 | 20000 | 25870 | 2332 |
| 1999 | 9515 | 60345 | 47456 | 20179 | 19165 | 10804 |
| 2000 | 9415 | 84553 | 47545 | 24620 | 22093 | 1274 |
| 2001 | 5750 | 74759 | 33510 | 14639 | 15666 | 814 |
| 2002 | 10213 | 84393 | 52230 | 25871 | 18355 | 1716 |
| 2003 | 7750 | 43244 | 29984 | 17456 | 13610 | 796 |
| 2004 | 90540 | 156739 | 121249 | 97387 | 26995 | 2285 |
| 2005 | 13423 | 138577 | 138900 | 116389 | 23832 | 1096 |
| 2006 | 29991 | 204273 | 173720 | 136902 | 70715 | 11688 |
| 2007 | 28880 | 206384 | 201150 | 142695 | 68019 | 57777 |
| 2008 | 46084 | 288676 | 256396 | 186005 | 81660 | 7221 |
| 2009 | 74964 | 495060 | 457546 | 328700 | 149679 | 64998 |
| 2010 | 21633 | 494363 | 294729 | 225282 | 107515 | 0 |
| 2011 | 22489 | 497108 | 287908 | 227300 | 219569 | |
| 2012 | 18371 | 466698 | 280193 | 235693 | 204892 | |
| 2013 | 19104 | 480873 | 345640 | 258098 | 223279 | |
| 2014 | 14423 | 334804 | 255393 | 190601 | 127303 | |
| 2015 | 7483 | 312000 | 250000 | 177000 | 126165 | |
| 2016 | 6288 | 140568 | 184221 | 154237 | 85301 | |
| 2017 | 9074 | 147594 | 244722 | 195725 | 78812 |
Serbia