The trends of nesting populations of 12 bird species out of a total of 25 for the period stretching between 1990 and 2017 have been analysed. The analysis did not include irregular (Anas crecca, Anas acuta) and new nesting birds (Tadorna tadorna and Mergus merganser). The Bird Protection and Study Society of Serbia made two rounds of assessments (Puzović et al., 2003; Puzović et al. 2015) of populations of all nesting birds species in Serbia (including 25 selected aquatic habitats species), as well as trends expressed as a percentage of change population (1990–2003 and 2000–2013, respectively). The assessed population is expressed in terms of minimum and maximum number of pairs. Based on the above data, the report lists assessments for four specific years: 1990, 2003, 2008 and 2013, with numbers for 1990 and 2008 calculated on the basis of estimates from 2003 and 2013. The indicators used for both groups were changes in abundance in the course of four years (as percentual change compared to the abundance in 1990) and the number of species with increasing, declining and stable/fluctuating trends in the periods 1990–2003 and 2000–2013.
Studying of birds in Serbia significantly improved in the period 2008 – 2013 compared to 1990–2003. Similarly to the case of birds of meadow and forest habitats, the number of certain species of birds in aquatic habitats was probably underestimated during the first assessment period, which gave the impression that their population had grown. However, the trend, assessed on the basis of monitoring in certain areas, indicates a different direction of change. Trend estimates were considered more accurate, which is why species with unrealistically large population changes were excluded from the analysis.
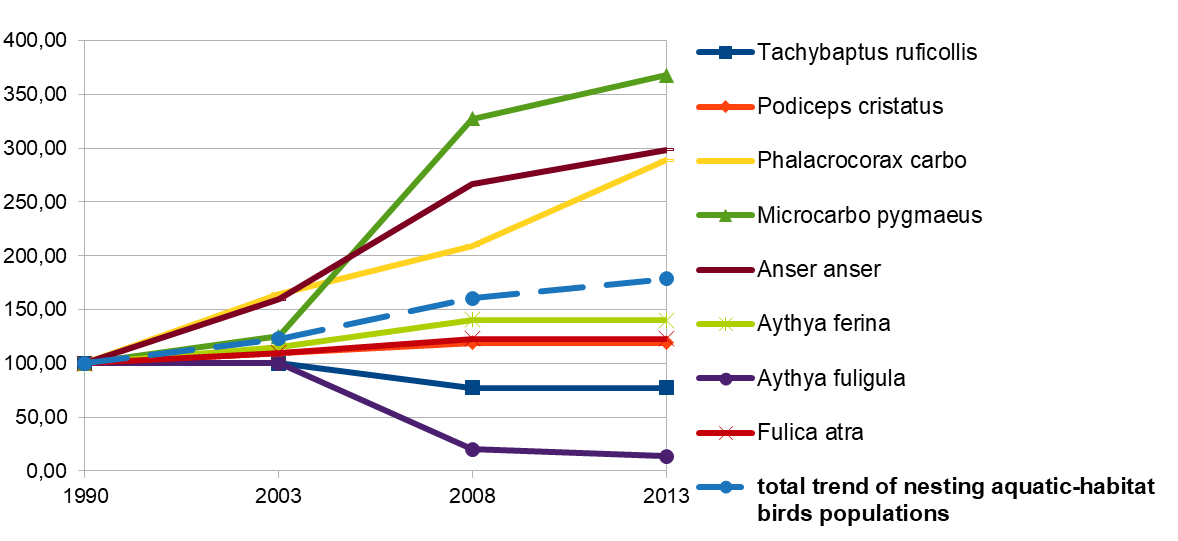
It can be assumed that the nesting populations of great and pygmy cormorants and wild geese in Serbia are being recovered, after they were reduced to a minimum in the mid-last century. On the other hand, most of the remaining nesting birds have a stable trend.
Subindicator Name: Nesting aquatic-birds populations trends
Institution/Author: Environmental Protection Agency/Slaviša Popović, Society for the Study and Protection of Birds/Milan Ružić, Dr Dimitrije Radišić
Use and interpretation:
The indicator shows the trend of changes in the population abundance of selected bird species. The change in the population of birds explains the loss, and change in the structure of their habitats, due to fragmentation and isolation, as well as other changes in the environment that directly or indirectly affect the change in population structure.
Key question(s) which indicator helps to answer
The indicator helps to answer the question: What is the trend in population growth of selected species?
Use of indicator
The trends of nesting populations of 12 bird species out of a total of 25 for the period stretching between 1990 and 2017 have been analysed. The analysis did not include irregular (Anas crecca, Anas acuta) and new nesting birds (Tadorna tadorna and Mergus merganser). The Bird Protection and Study Society of Serbia made two rounds of assessments (Puzović et al., 2003; Puzović et al. 2015) of populations of all nesting birds species in Serbia (including 25 selected aquatic habitats species), as well as trends expressed as a percentage of change population (1990–2003 and 2000–2013, respectively). The assessed population is expressed in terms of minimum and maximum number of pairs. Based on the above data, the report lists assessments for four specific years: 1990, 2003, 2008 and 2013, with numbers for 1990 and 2008 calculated on the basis of estimates from 2003 and 2013. The indicators used for both groups were changes in abundance in the course of four years (as percentual change compared to the abundance in 1990) and the number of species with increasing, declining and stable/fluctuating trends in the periods 1990–2003 and 2000–2013.
Scale of appropriate use
Number of population of selected bird species and population growth through the time and by habitats. Changes of the most important types of habits, according to CORINE Land Cover and EUNIS.
Potential for aggregation:
Meaning of upward or downward trends (“good or bad”)
The periodicity of data collection: Bird Protection and Study Society of Serbia collect and analyse data. The indicator also relates to trend in changing of the most important types of habitats according to CORINE Land Cover and EUNIS, which means dynamics of changes in the area of forest, meadows, mixed and other types of habitats.
Possible reasons for upward or downward trends:
The indicator is determined annually, and it is important for monitoring population growth of selected bird species.
Implications for biodiversity management of change in the indicator:
The indicator is traditionally described in annual state-of-the-environment reports in Serbia, and it is determined as biodiversity indicator, according to The Rulebook on the National list of environmental protection indicators (Official Gazette of the Republic of Serbia No. 37/2011).
Units in which it is expressed:
The number of individuals per unit area. Number of breeding pairs. Surface expressed in hectares (ha).
Description of source data:
Bird Protection and Study Society of Serbia
Calculation procedure:
Trend in changes of population abundance of selected species of birds according to the expert and administrative lists and methodology of counting and assessment developed by the European Agency for Environmental Protection. Dynamic of habitat changing of habitats according to EUNIS classification and / or the CORINE Land Cover methodology.
Most effective forms of presentation:
(graph types, maps, narratives, etc.-give examples where possible):
The best ways to present this indicator are tables and graphs and they provide opportunity to monitor progress regarding this indicator and to record trends observed.
Limits to usefulness and accuracy:
Access to data, slow data exchange and update
Updating the indicator:
Annually.
Closely related indicators:
Diversity of species-birds population trend
Additional information and comments:
Table: Nesting aquatic-birds populations trends
| Latin name | 1990 | 2003 | 2008 | 2013 |
| Tachybaptus ruficollis | 100,00 | 100,00 | 77,39 | 77,39 |
| Podiceps cristatus | 100,00 | 110,03 | 119,09 | 119,09 |
| Phalacrocorax carbo | 100,00 | 164,92 | 209,30 | 288,61 |
| Microcarbo pygmaeus | 100,00 | 125,00 | 327,35 | 367,65 |
| Anser anser | 100,00 | 159,72 | 266,67 | 298,61 |
| Mareca strepera | 100,00 | 100,00 | 482,00 | 541,00 |
| Anas platyrhynchos | 100,00 | 85,00 | 40,47 | 36,92 |
| Aythya ferina | 100,00 | 114,98 | 140,34 | 140,28 |
| Aythya fuligula | 100,00 | 100,00 | 20,00 | 13,75 |
| Mergus merganser* | 100,00 | 750,00 | 1766,67 | 2000,00 |
| Fulica atra | 100,00 | 109,99 | 122,82 | 122,82 |
| Alcedo atthis | 100,00 | 100,00 | 223,33 | 223,33 |
| Total trend | 100,00 | 123,08 | 160,37 | 178,52 |
Serbia