Key message: Since 2010, there have not been exceedances of limit values for air quality parameters for SO2, NO2 and PM10 in protected areas. Only in the summer period there have been exceedances of target value for ground level ozone
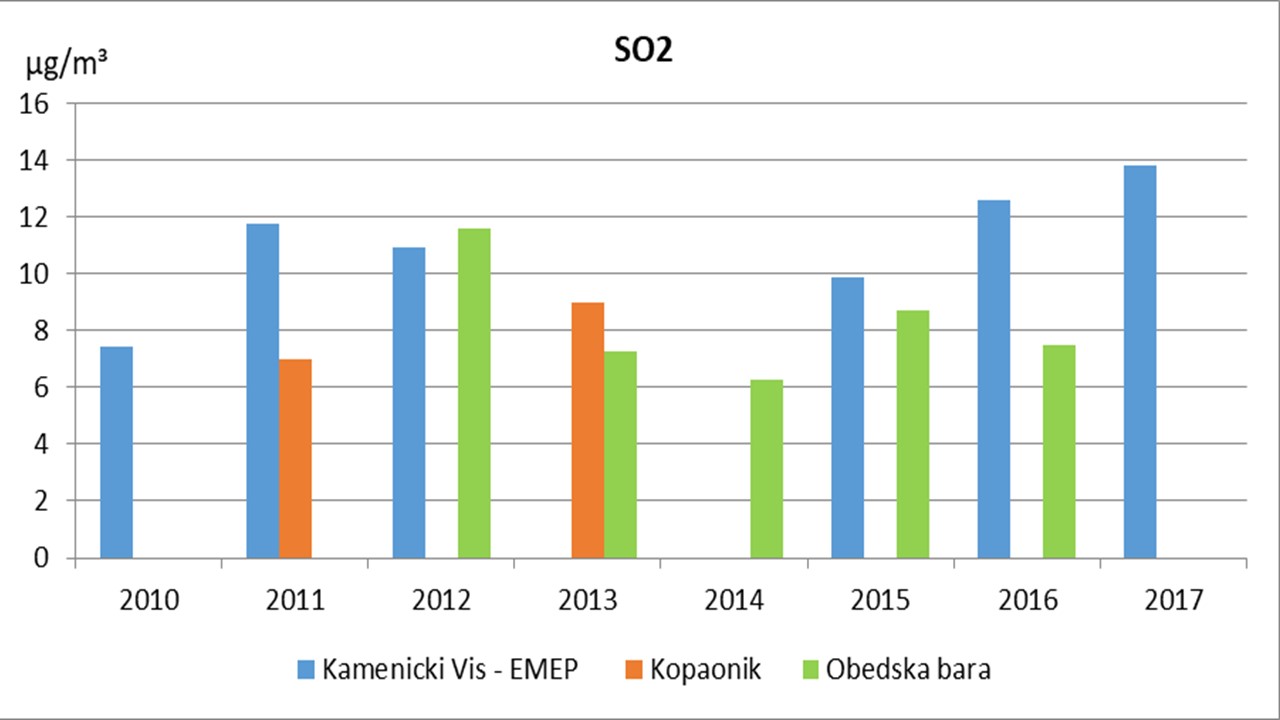
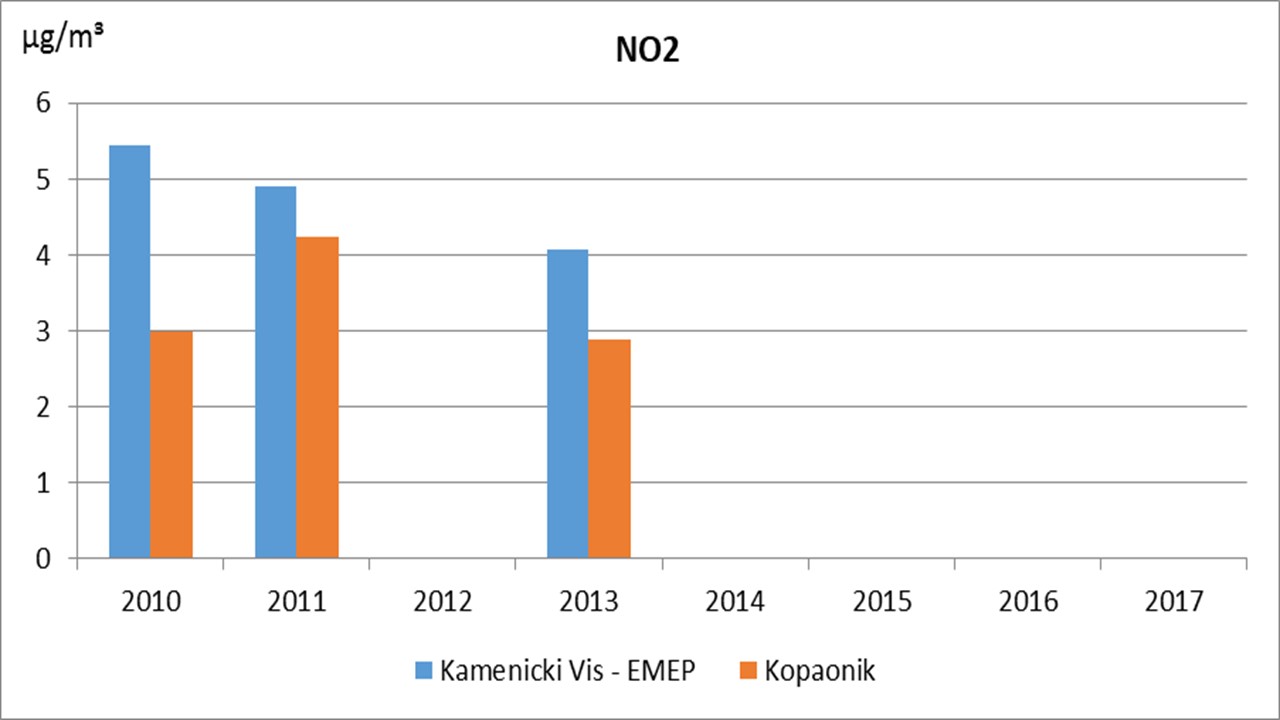
Assessment: The indicator shows the exceedances of annually limit values for air quality parameters for SO2, NO2, PM10, and O3 in the protected areas. The indicator describes the state of the environment in terms of air quality pollution. The indicator is calculated based on data of the national and local networks for monitoring of air quality from daily SO2, NO2, and PM10 concentrations and max eight-hour values for O3 concentration. Since 2010, there have not been exceedances of limit values for air quality parameters for SO2, NO2, PM10 in protected areas. Only in the summer period there have been exceedances of target value for ground level ozone. Protected areas are the only part of the territory of the Republic of Serbia where operational air quality monitoring is carried out. Parameters that are measured, because of their negative effects on people, plant and animal life, are sulphur dioxide (SO2), nitrogen dioxide (NO2), carbon monoxide (CO, suspended particles smaller than 10 micrometres (PM10) and diameters smaller than 2.5 micrometres (PM2.5) and ground-level ozone (O3). The graphs show the concentrations of the mentioned parameters in protected areas, and increased limit values of concentrations are not recorded for any parameter, except for the target value of ground-level ozone for the protection of vegetation of TV AOT40 in Kopaonik, Kamenički Vis and Obedska Bara. The graph below shows trend of a slight increase in concentrations of SO2 and trend of reducing concentrations of NO2 in the selected protected areas since 2014.
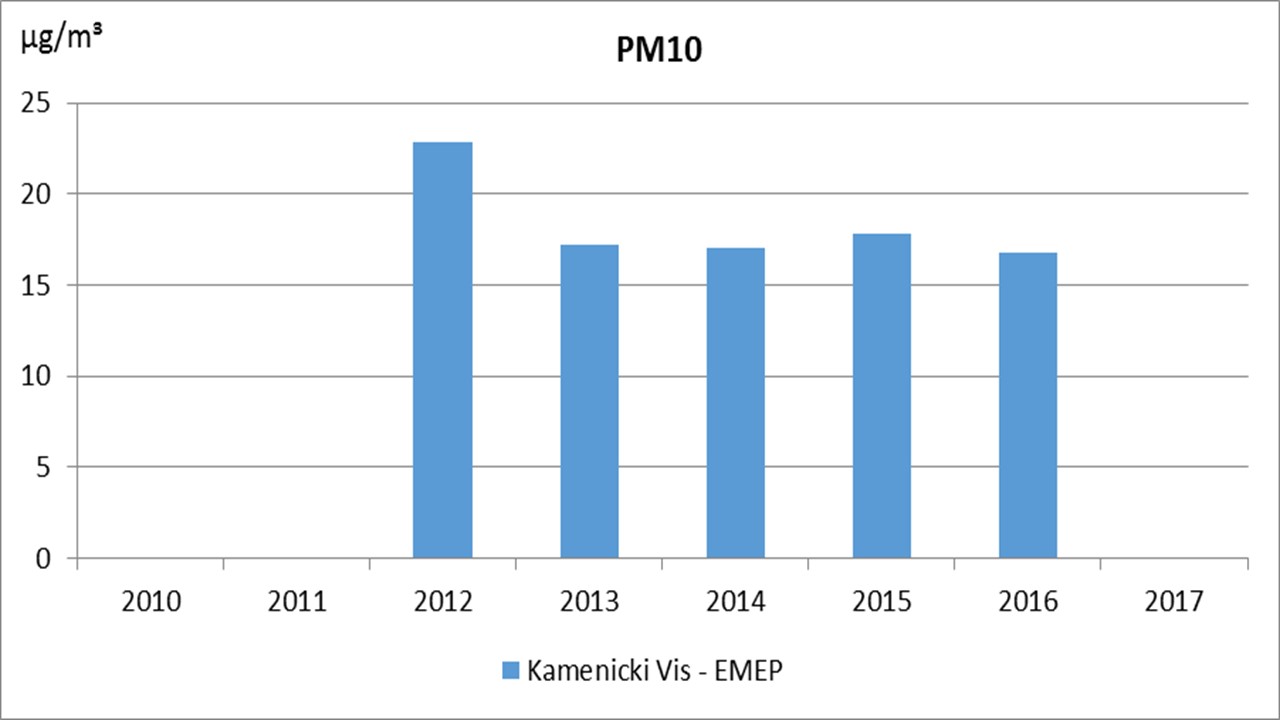
The graph below (left) shows the trend of reducing concentrations of PM10 at the location Kamenički Vis since 2012. The graph below (right) shows the trend of concentrations of ground-level ozone for protection of vegetation (AOT40), on four locations: Kopaonik, Kamenički Vis, Obedska Bara and Deliblatska peščara. Ground-level ozone had the biggest negative impact on vegetation in 2012 in the selected protected areas.

Indicator Name: Air quality in the selected protected areas
Institution/Author: Environmental Protection Agency/Lidija Marić
Use and interpretation: The indicator shows the exceedances of annually limit values for air quality parameters SO2, NO2, PM10, and O3 in the protected areas. The indicator describes the state of the environment in terms of air quality pollution The indicator is calculated based on the data of the national and local networks for monitoring of air quality from daily SO2, NO2, PM10 concentrations and maximal eight-hour values for O3 concentration.
Key question(s) which indicator helps to answer: The indicator helps to answer the question: What is the state of air quality in the protected areas?
Use of indicator: For air quality monitoring in protected areas and impact on biodiversity.
Scale of appropriate use: Since 2010, there have not been exceedances of limit values for air quality parameters SO2, NO2 and PM10 in protected areas. Only in the summer period there were exceedances of target value for ground level ozone.
Potential for aggregation:
Meaning of upward or downward trends („good or bad“): Upward trends are bad, because it means that air pollution is growing from year to year, and it would have a negative impact on biodiversity.
Possible reasons for upward or downward trends: The possible reasons for different trends can be from natural and human factor. Upward trends of air quality pollution in the protected areas would have a negative impact on biodiversity.
Implications for biodiversity management of change in the indicator: The indicator is described in the Annual Report on State of the Environment of the Republic of Serbia and annual Air Quality Report. The Rulebook on the National list of environmental protection indicators (Official Gazette of the Republic of Serbia No. 37/2011). This indicator will be taken into account for the purpose of implementation of the Biodiversity Strategy.
Units in which it is expressed: Concentrations of the air quality pollutants are expressed in micrograms per cubic meter (µg/m³)
Description of source data: Serbian Environmental Protection Agency and local networks for air quality monitoring
Calculation procedure: According to the criteria of Air Quality monitoring.
Most effective forms of presentation: The best way to present this indicator is a graph.
Limits to usefulness and accuracy: (e.g. slow change in response to pressures, poor quality data, limited scope for updating)
Updating the indicator: Data are updated annually.
Closely related indicators: Frequency of exceeding daily limit values for SO2, NO2, PM10, O3
Additional information and comments:
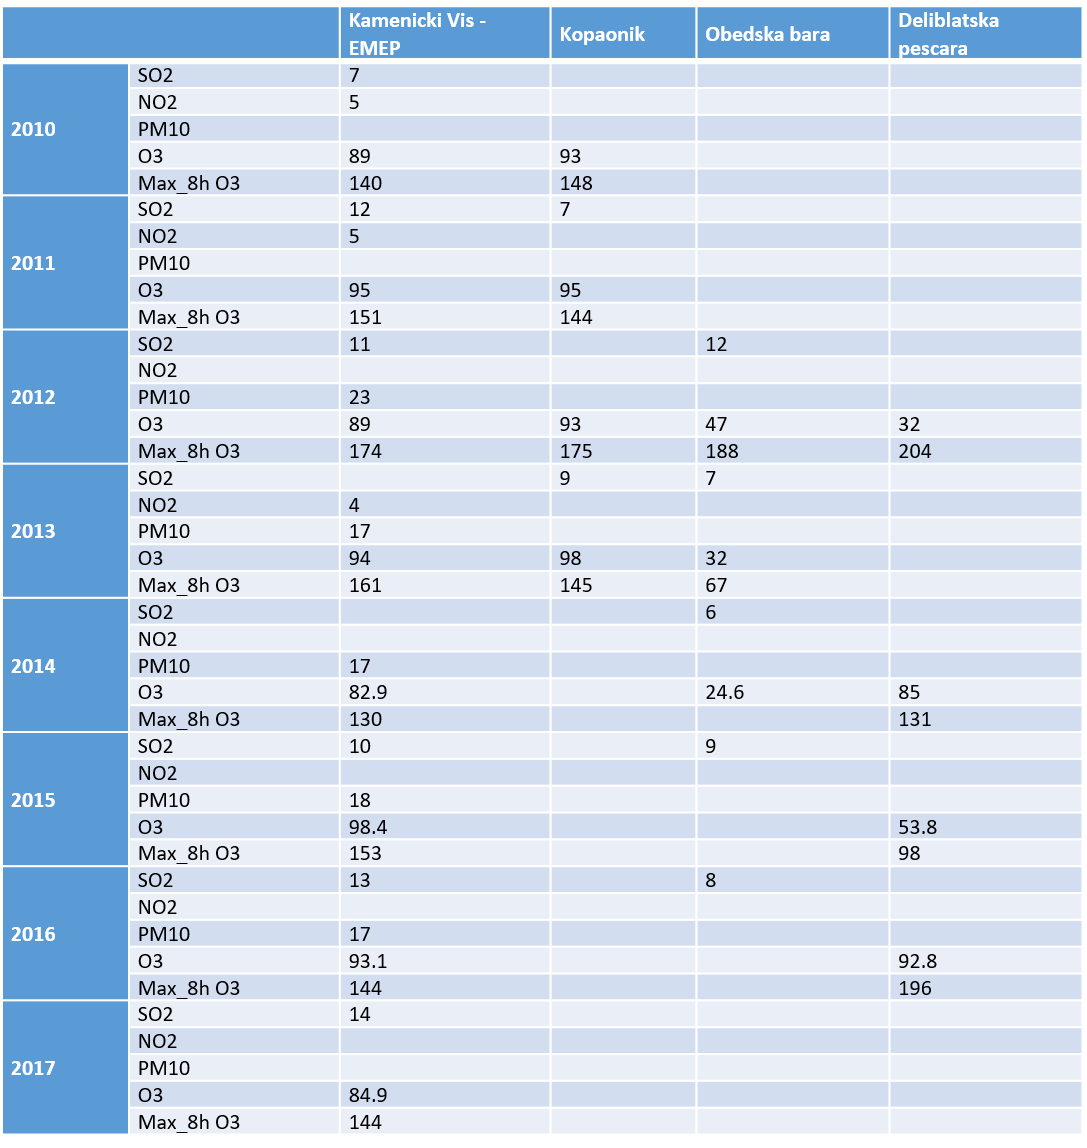
Table: Air quality in protected areas
Serbia