Key message: The number of supported projects increased significantly and the amount of funds slightly increased from 2010 to 2016
Assessment: The indicator shows the relation between the number of all financed projects and the projects related to biodiversity protection, but also the relation between the amount of total funds for the projects per year and the funds for biodiversity protection projects during the period of 2010-2016. In the period of 2010-2011, the funds were provided also through the Environmental Protection Fund of the Republic of Serbia. The results show that the funds varied from year to year but reached the highest level during the period of 2010-2011 due to additional financial sources. Generally, the number of supported projects and also the amount of funds (chart above) decreased from 2010 to 2016, but in the case of percentage ratio of the total number of supported projects and biodiversity protection projects, as well as in the case of a percentage of the amount of financial resources spent on all projects in relation to biodiversity protection projects (chart 3), there is a slight positive trend. This means that the number of projects and the amount of funds allocated for biodiversity protection projects have increased over time as compared to the total funds available for the work of CSOs in Vojvodina.


Indicator Name: Public participation through financing the projects of NGOs in Vojvodina
Institution/Author: Provincial Secretariat for Urban Planning and Environmental Protection/ Lorand Vigh, Olivia Tešić, Tamara Stojanović
Use and interpretation:
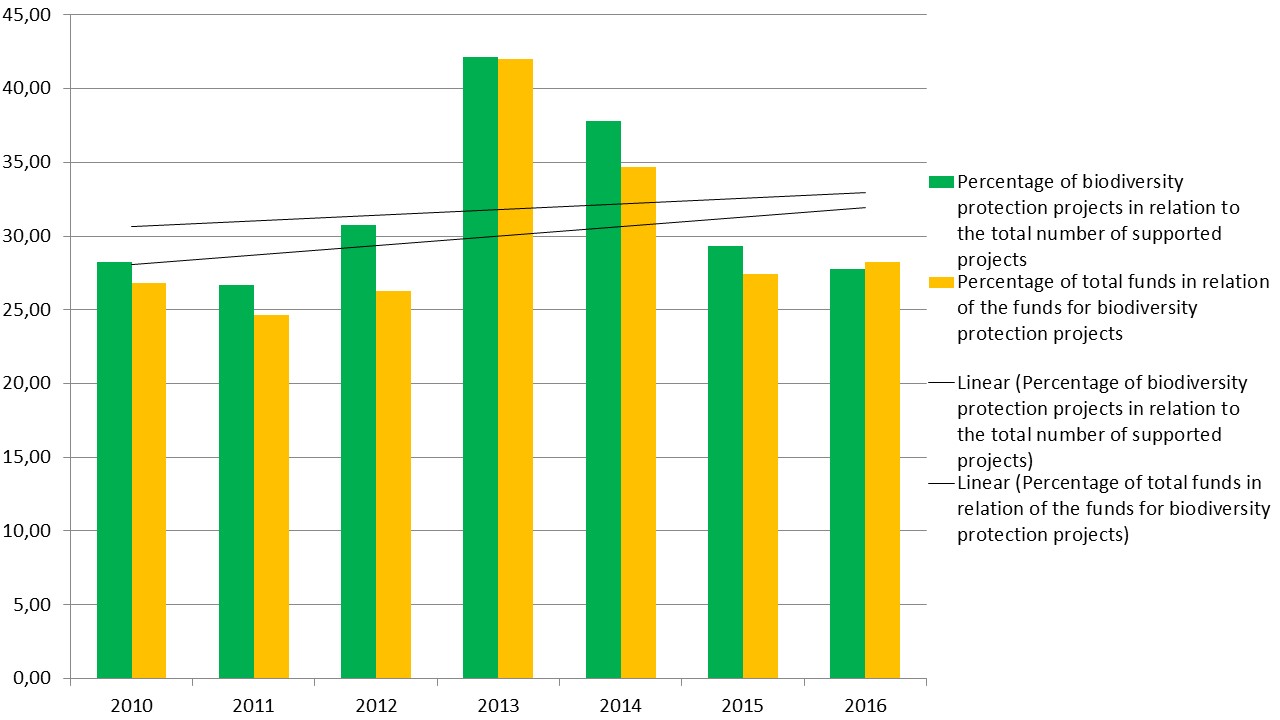
Provincial Secretariat for Urban Planning and Environmental Protection financially supported projects of NGOs working in the field of environmental protection on the territory of Vojvodina. The financial support were awarded within the framework of a call of proposals that was announced each year within the period of 2007-2016. The indicator shows the relation between number of all of the supported projects and the projects related to biodiversity protection, but also the relation between the amount of the total funds for the projects per year and the funds for the biodiversity protection projects during 2010-2016. The annual amount of financial support depended on the financial plan adopted by the Provincial Assembly prepared by the Provincial Secretariat for Urban Planning and Environmental Protection for each year according to the overall budget for the Autonomous Province of Vojvodina. It is important to add that in the period of 2010-2011, the funds were provided also through the Environmental Protection Fund of the Republic of Serbia. The results show that the funds varied from year to year, but reached the highest level during the period 2010-2011 due to additional financial sources. Generally, the number of supported projects and also the amount of funds decreased from 2010 to 2016, but in the case of a percentage ratio of the total number of supported projects and biodiversity protection projects, as well as in the case of a percentage of the amount of financial resources spent on all projects in relation to biodiversity protection projects, there is a slight positive trend. This means that the number of projects and the amount of funds allocated for biodiversity protection projects has increased over time as compared to the total funds available for the work of NGOs in Vojvodina.
Potential for aggregation: good
Possible reasons for upward or downward trends:
The annual amount of financial support depends on the adopted financial plan by the Provincial Assembly prepared by the Provincial Secretariat for Urban Planning and Environmental Protection for each year according to the overall budget for the Autonomous Province of Vojvodina. The reason for the upward trend in the percentage representation of projects and the amount of funds spent on biodiversity conservation projects can be increased public awareness of the need to preserve natural values in relation to some general environmental issues.
Implications for biodiversity management of change in the indicator:
Units in which it is expressed: Serbian dinars, %
Description of source data: Financial plans of Provincial Secretariat for Urban Planning and Environmental Protection, contracts with the NGOs, type of activities within the project proposals
Calculation procedure:
The indicator shows the ratio between total funds for the projects and the funds allocated for the biodiversity protection projects, as well as the ratio between the overall number of supported projects and the number of biodiversity protection projects.
Most effective forms of presentation: Tables ang graphs
Limits to usefulness and accuracy: From 2017 and on, there have been no calls for proposals announced for NGOs in Vojvodina by the Provincial Secretariat for Urban Planning and Environmental Protection
Updating the indicator: per year
Closely related indicators
Additional information and comments
Table: Number of the projects and amount of funds for projects of NGO in Vojvodina during 2010-2016
| Years | Number of all supported projects | Supported projects on biodiversity protection | % | Total funds | Funds for biodiversity protection | % |
| 2010 | 92 | 26 | 28,26 | 11.424.000,00 | 3.060.000,00 | 26,79 |
| 2011 | 90 | 24 | 26,67 | 9.930.000,00 | 2.450.000,00 | 24,67 |
| 2012 | 26 | 8 | 30,77 | 1.600.000,00 | 420.000,00 | 26,25 |
| 2013 | 38 | 16 | 42,11 | 2.000.000,00 | 840.000,00 | 42 |
| 2014 | 45 | 17 | 37,78 | 3.000.000,00 | 1.040.000,00 | 34,67 |
| 2015 | 116 | 34 | 29,31 | 8.600.000,00 | 2.356.000,00 | 27,4 |
| 2016 | 54 | 15 | 27,78 | 2.000.000,00 | 565.000,00 | 28,25 |
| Total | 461 | 140 | 30,37 | 38.554.000,00 | 10.731.000,00 | 27,83 |