Key message: The increase in resource productivity is higher than domestic materials consumption growth
Assessment: This indicator is developed within the Serbian Environmental Protection Agency environmental information system. The indicator is calculated annually at the national level, based on the Eurostat data. The indicator shows trend of domestic material consumption (DMC) and trend of resource productivity. Resource productivity is elementary indicator of sustainable production and consumption and is a part of the UN Sustainable Development Goal 17 according to Agenda 2030. Resource productivity is calculated as the ratio between gross domestic product (GDP) and domestic materials consumption (DMC), and shows how productive the use of resources is. If GDP increases higher than DMC, productivity of resources also increases, and vice versa.
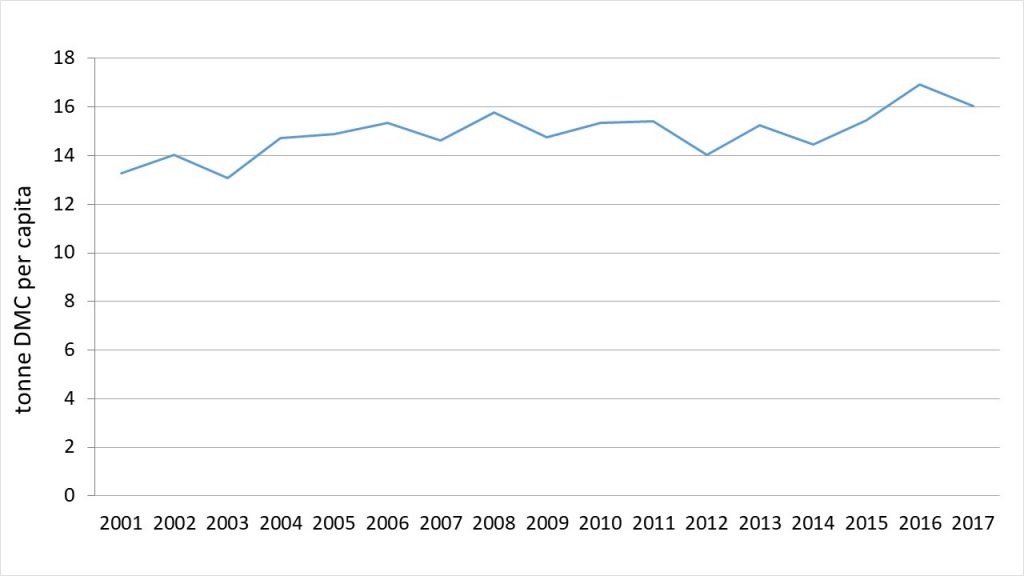
Total domestic materials consumption (DMC) in Serbia increased from 0.099 million tons in 2001 to 0.112 million tons in 2017, an increase of 12.9%, i.e. the trend has a negative significance. By way of comparison, in the same period, the DMC in the EU declined by 9%. DMC per capita in Serbia has increased from 13.28 tons in 2001 to 16.03 tons in 2017, an increase of 20.7%, the trend has a negative connotation.
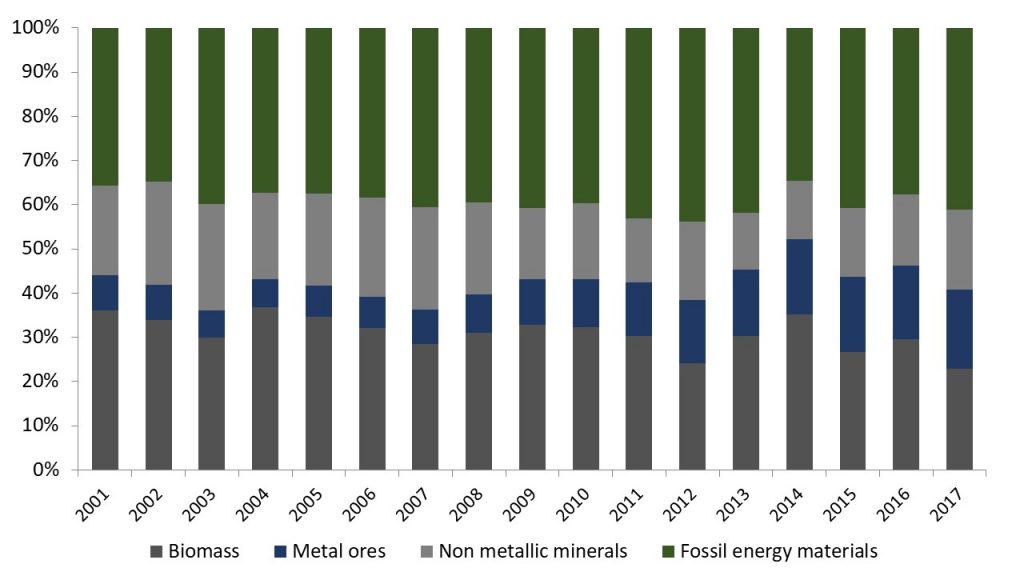
The main components of total DMC are biomass, fossil fuels, non-metallic minerals (usually materials used in construction), metals (and metal ores). The share of the four major components of the total DMC varied widely between 2000 and 2017. The biomass share significantly oscillated, with a downward trend from 36% to 24%, while the share of fossil fuels increased from 36% to 43%. Non-metallic minerals vary from 25% to 14%. The smallest group is metals and metal ores, which increased from 8% to 19% DMC in Serbia.
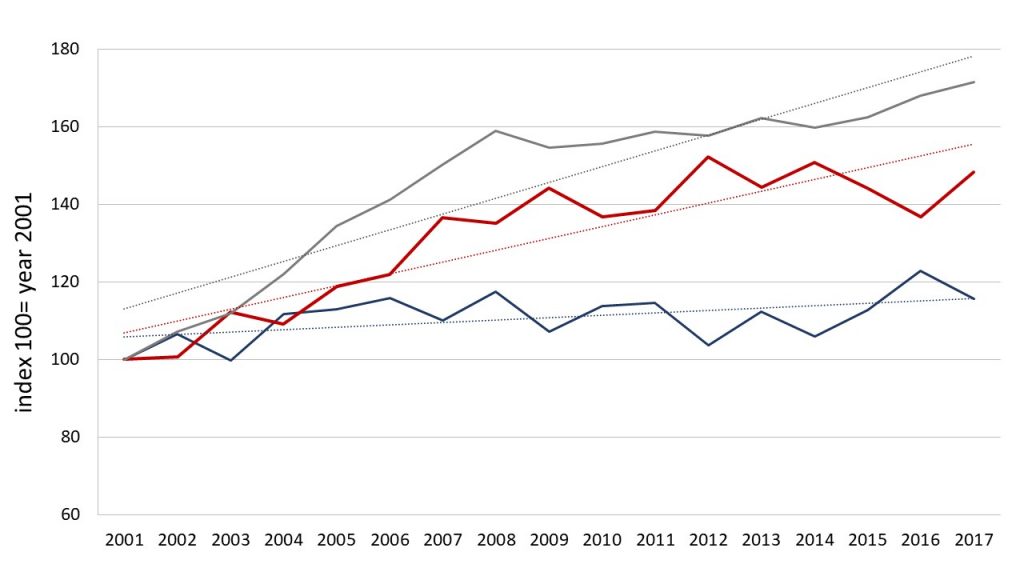
In the period 2001-2017, the increase in resource was by 48%, GDP by 71%, and DMC by 16%. This means that Serbia had achieved only a relative decoupling economic growth from resource consumption, which is the trend with relatively positive meaning. For the sake of comparison, during the same period, resource productivity in the EU had increased by 38%, and GDP by 24%, while DMC fell by 10%. Accordingly, the EU had achieved an absolute decoupling economic growth from resource consumption, the trend has a positive meaning.
Indicator name: Domestic material consumption and resource productivity
Institution/Author: Environmental Protection Agency/Maja Krunić-Lazić
Use and interpretation:
Domestic material consumption (DMC): DMC indicates the total amount of material actually consumed domestically by resident units.
Resource productivity:
The indicator is defined as the gross domestic product (GDP) divided by domestic material consumption (DMC). DMC measures the total amount of materials directly used by an economy. It is defined as the annual quantity of raw materials extracted from the domestic territory of the local economy, plus all physical imports minus all physical exports. It is important to note that the term ‘consumption’, as used in DMC, denotes apparent consumption and not final consumption. DMC does not include upstream flows related to imports and exports of raw materials and products originating outside of the local economy.
Key question(s) which indicator helps to answer
The indicator helps to answer a question: Does Serbia have a trend of efficient use of resources?
Use of indicator
The indicator relates to the total area of the Republic of Serbia.
To measure how much is present in Serbia trend of efficient use of resources. The users include policy makers in environmental ministries, environmental organisations, researchers, students and interested citizens. The indicator “Resource Productivity” is the lead indicator of the EU resource efficiency flagship initiative under the Europe 2020 strategy.
Scale of appropriate use
Total area of the Republic of Serbia. According to that, the indicator is compatible with indicators of the same size.
Potential for aggregation:
It is not possible to analyse the level of administrative regions and districts.
Meaning of upward or downward trends (“good or bad”)
Upward trend is “good”, downward trend is “bad”.
Possible reasons for upward or downward trends:
The indicator is determined annually. Possible reasons for upward or downward trends are the change in the domestic material consumption (DMC), or gross domestic product (GDP).
Implications for biodiversity management of change in the indicator:
The main components of total DMC are biomass, fossil fuels, non-metallic minerals (mainly materials used in civil engineering) and metals (and metallic ores). Biomass in Serbia makes around 60% of planned energy generation from renewable sources. Taking into account that solid biomass is made of heating wood, pellet and briquettes, the indicators are clearly connected to biodiversity.
Units in which it is expressed:
Domestic material consumption: million tonnes;
Resource productivity: Euro per kilogram, chain linked volumes (2010), and index (2001 year is 100)
Description of source data:
Statistical Office of the Republic of Serbia (SORS) and Eurostat: Material flow accounts [env_ac_mfa], Total, Thousand tonnes; Resource productivity [env_ac_rp], Euro per kilogram, chain linked volumes (2010); GDP at market prices, Chain linked volumes (2010), million euro.
Periodicity of collecting: per year
Calculation procedure:
Domestic material consumption – data are downloaded from the SORS and recalculated for the purposes of indicators.
Resource productivity – data are downloaded from Eurostat and recalculated for the needs of indicators, while SORS does not harmonize the methodology with Eurostat.
Most effective forms of presentation:
The best way of presenting this indicator in tables and charts that provide an opportunity to monitor progress in relation to this indicator and record the observed trends.
Limits to usefulness and accuracy:
/
Updating the indicator:
Statistical data are updated once a year.
Closely related indicators:
There is no.
Additional information and comments:
/
Analysis
Total domestic materials consumption (DMC) in Serbia increased from 0.099 million tons in 2001 to 0.112 million tons in 2017, an increase of 12.9%, i.e. the trend has a negative significance. By way of comparison, the DMC in the EU declined by 9% in the same period.
DMC per capita in Serbia has increased from 13.28 tonnes in 2001 to 16,03 tonnes in 2017, an increase of 20.7%, and that trend has a negative connotation.
The share of the four major components of the total DMC varied widely between 2000 and 2017. The biomass share significantly oscillated, with a downward trend of 36% to 24%, while the share of fossil fuels increased from 36% to 43%. Non-metallic minerals (mainly materials used in construction), varied from 25 to 14%. The smallest group is metals and metal ores, which are increased from 8% to 19% DMC in Serbia.
In the period 2001-2017, the increase in resource productivity is by 48%, GDP by 71%, and DMC by 16%. Which means that Serbia has achieved only a relative decoupling economic growth from resource consumption, that is the trend has a relatively positive meaning. For comparison, the EU resource productivity increased by 38% in the same period, and GDP by 24%, while the DMC fell by 10%. Accordingly, the EU has achieved an absolute decoupling of economic growth from resource consumption, and that trend has a positive meaning.
Table 1: Domestic materials consumption and resourse productivity in Serbia and EU
| EU-28 | EU-28 | EU-28 | Serbia | Serbia | Serbia | |
| DMC | Res. Produc. | GDP | DMC | Res. Produc. | GDP | |
| 2000 | ||||||
| 2001 | 100 | 100 | 100 | 100 | 100 | 100 |
| 2002 | 98,70762 | 102,6883 | 101,3637 | 106,4892 | 100,6244 | 107,1159 |
| 2003 | 98,29983 | 104,485 | 102,7075 | 99,66964 | 112,2478 | 111,8455 |
| 2004 | 103,2207 | 101,9963 | 105,284 | 111,7863 | 109,1258 | 121,9638 |
| 2005 | 104,1011 | 103,2672 | 107,5014 | 113,0211 | 118,8761 | 134,3479 |
| 2006 | 106,0318 | 104,7445 | 111,0617 | 115,8154 | 121,95 | 141,2103 |
| 2007 | 109,2954 | 104,7511 | 114,4928 | 110,0445 | 136,5994 | 150,3036 |
| 2008 | 107,2296 | 107,3064 | 115,0674 | 117,5596 | 135,1105 | 158,804 |
| 2009 | 94,39446 | 116,629 | 110,0911 | 107,2036 | 144,1402 | 154,466 |
| 2010 | 91,41297 | 122,9305 | 112,3753 | 113,7832 | 136,7915 | 155,595 |
| 2011 | 95,78907 | 119,3705 | 114,348 | 114,6704 | 138,4726 | 158,7636 |
| 2012 | 88,61934 | 128,5201 | 113,8969 | 103,689 | 152,1134 | 157,6814 |
| 2013 | 86,81446 | 131,5611 | 114,2176 | 112,3449 | 144,4284 | 162,2428 |
| 2014 | 88,06762 | 132,0136 | 116,2621 | 106,007 | 150,6724 | 159,6637 |
| 2015 | 88,25233 | 134,815 | 118,9774 | 112,6728 | 144,2363 | 162,4998 |
| 2016 | 87,93354 | 138,0556 | 121,3991 | 122,7852 | 136,7915 | 167,9279 |
| 2017 | 89,89748 | 138,3351 | 124,363 | 115,6103 | 148,2709 | 171,3692 |
Table 2: The structure of domestic material consumption
| Domestic Material Consumption (DMC) by materials, 2001–2017, in ‘000 tonnes | ||||
| Biomass | Metal ores | Non metallic minerals | Fossil energy materials | |
| 2001 | 35.968 | 7.775 | 20.276 | 35.413 |
| 2002 | 35.652 | 8.293 | 24.526 | 36.546 |
| 2003 | 29.175 | 5.956 | 23.475 | 38.844 |
| 2004 | 40.290 | 6.963 | 21.354 | 40.732 |
| 2005 | 38.360 | 7.800 | 23.019 | 41.416 |
| 2006 | 36.480 | 7.891 | 25.493 | 43.616 |
| 2007 | 30.648 | 8.456 | 24.968 | 43.809 |
| 2008 | 35.880 | 10.208 | 24.113 | 45.673 |
| 2009 | 35.476 | 11.108 | 17.348 | 44.032 |
| 2010 | 36.211 | 12.012 | 19.341 | 44.353 |
| 2011 | 33.886 | 13.488 | 16.260 | 48.048 |
| 2012 | 24.387 | 14.470 | 17.931 | 44.173 |
| 2013 | 33.101 | 16.385 | 14.138 | 45.750 |
| 2014 | 36.368 | 17.495 | 13.563 | 35.679 |
| 2015 | 29.280 | 18.662 | 17.070 | 44.560 |
| 2016 | 35.283 | 19.997 | 19.295 | 44.913 |
| 2017 | 25.741 | 20.122 | 20.474 | 46.272 |
Table 3: Domestic consumption of material (DMC) per capita
| tonne DMC per capita |
| 2001 | 13,28 |
| 2002 | 14,04 |
| 2003 | 13,06 |
| 2004 | 14,71 |
| 2005 | 14,90 |
| 2006 | 15,34 |
| 2007 | 14,63 |
| 2008 | 15,77 |
| 2009 | 14,75 |
| 2010 | 15,36 |
| 2011 | 15,43 |
| 2012 | 14,02 |
| 2013 | 15,26 |
| 2014 | 14,47 |
| 2015 | 15,46 |
| 2016 | 16,94 |
| 2017 | 16,03 |