Key message: In the period from 1990-2012. On the territory of MAB in Serbia, number of forests has increased
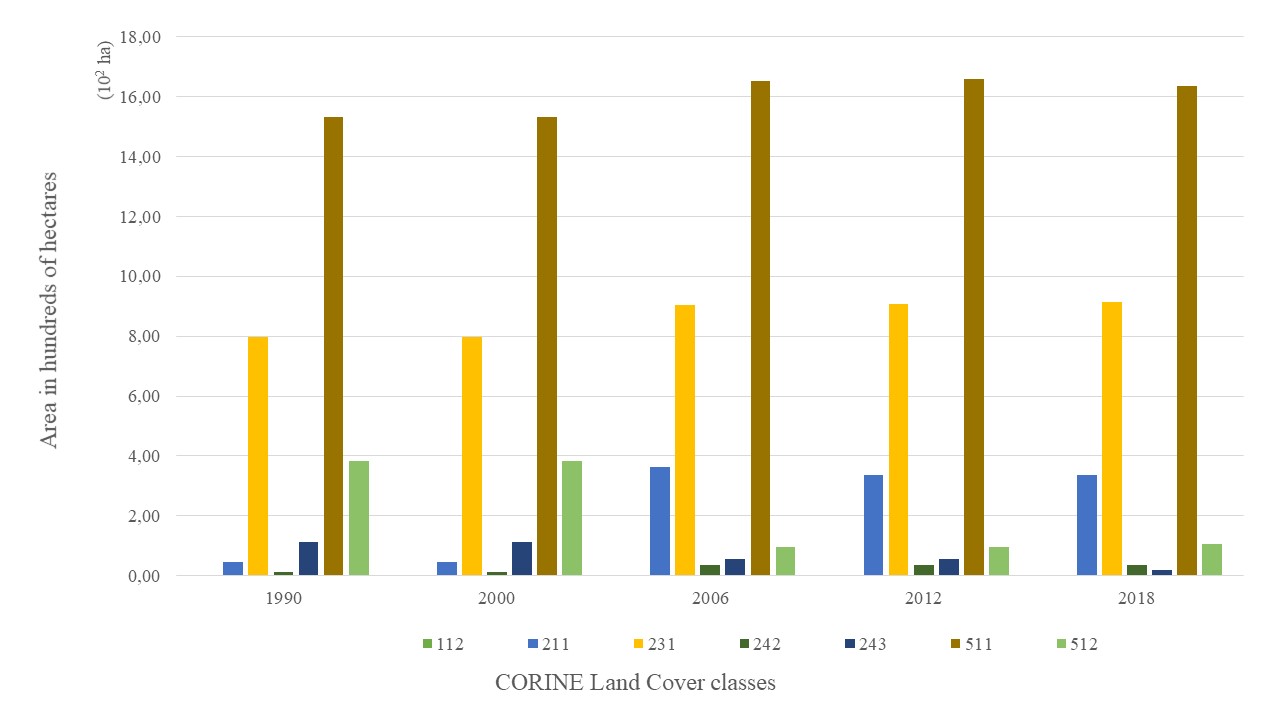
Assessment: The Special Nature Reserve “Gornje Podunavlje” is one of the best preserved wetland units throughout the Danube River, which has been under the protection of the state since 1989. The “Gornje Podunavlje” reserve is located on the border junction of Serbia, Croatia and Hungary and is part of a complex ecosystem that represents the largest flooding area on the mid Danube stream. In order to protect and conserve the entire floodplain,”Bačko Podunavlje” was approved as a UNESCO Biosphere Reserve in June 2017. According to the results of the analysis, it can be concluded that in this area there are two parts of urbanized surfaces and a negative trend of surface changes from 3.54 ha (1990) to 0.25 ha in 2012 was recorded. In the following period, no change in size was recorded. Although there are a large number of weekend settlements in this area, according to the 2011 Statistical Office of the Republic of Serbia, there is a decrease in the number of inhabitants in this area, which enables the domination of natural processes and natural habitat restoration.
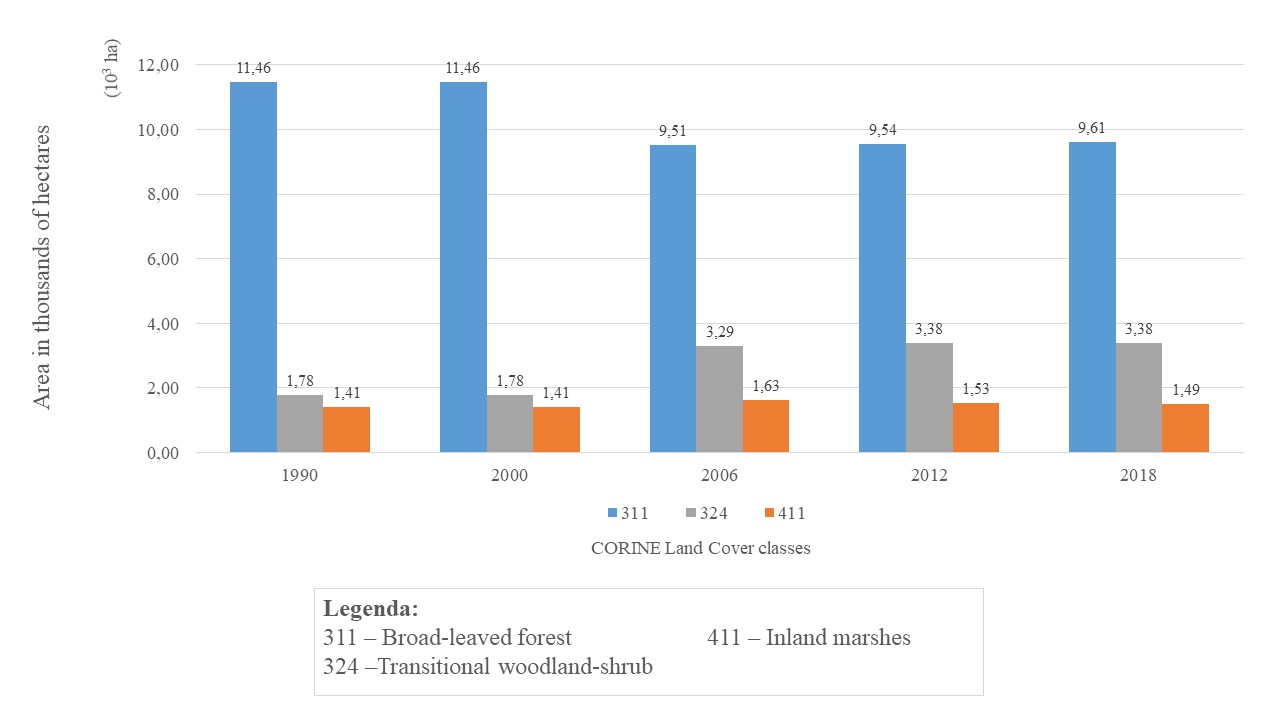
It is interesting to note that in the analyzed period the area and number of watercourses increased in 2006 from 1 533.00 ha (2000) to 1 651.50 ha. In 2018, the area was slightly smaller (1 635.90 ha), but there was a noticeable surface consolidation. Unlike watercourses, the number and area of water basins decreased from 384.42 ha in 1990 to just 94.45 ha in 2006, but in 2018 the area increased to 107.19 ha. It can be assumed that a reduction in the number of water basins caused an increase in the number of watercourses in 2006 and 2012, but the number of watercourses continued to decline in 2018. The cause of this can be changes in climate parameters. The results of the analysis of broadleaf forest surfaces, primarily of the wetland floodplain forests, show a decrease in the area of 11 458.14 ha in 1990 to 9 508.84 ha in 2006 with a higher degree of fragmentation. In the following period, the trend of increase in the area under forests (9 610.39 ha in 2018) was recorded, at the expense of the transitional forest/shrub surfaces. Increasing the surface of the transition area from 1 782.38 hectares in 1990 to 3 381.62 ha, corresponds to the changes recorded in the class of broad-leaved forests. It can be assumed that changes in these classes occurred in response to changes recorded in water basin and watercourse classes, that is, that a higher amount of water in water basins (107.19 ha) and a smaller number of watercourses positively influence the state of the natural forests and the transitional areas. It is important to note that in this area there is a positive trend of changes in surface under land swamps while simultaneously consolidating these habitats, from 1 406.67 ha in 1990 to 1 493.55 ha in 2018. Oscillations in the change in the surface of these habitats can be related to changes in the surface of the watercourse class.
Indicator Name: Protected Area „Gornje Podunavlje“, as a part of UNESCO MAB biosphere reserve “Backo Podunavlje”
Institution/Author: The Academy of Applied Technical and Preschool Studies – Department Vranje, Serbia/dr Jovana Džoljić
Use and interpretation:
The Special Nature Reserve “Gornje Podunavlje” is one of the best preserved wetland units throughout the Danube River, which has been under the protection of the state since 1989. The “Gornje Podunavlje” reserve is located on the border junction of Serbia, Croatia and Hungary and is part of a complex ecosystem that represents the largest flooding area on the mid Danube stream. In order to protect and conserve the entire floodplain,”Bačko Podunavlje” was approved as a UNESCO Biosphere Reserve in June 2017. According to the results of the analysis, it can be concluded that in this area there are two parts of urbanized surfaces and a negative trend of surface changes from 3.54 ha (1990) to 0.25 ha in 2012 was recorded. In the following period, no change in size was recorded. Although there are a large number of weekend settlements in this area, according to the 2011 Statistical Office of the Republic of Serbia, there is a decrease in the number of inhabitants in this area, which enables the domination of natural processes and natural habitat restoration.
Key question(s) which indicator helps to answer
Is there evidence about changes in habitat types in biosphere reserves? What is the level of changes and which classes are the most exposed?
Use of indicator
It is interesting to note that in the analyzed period the area and number of watercourses increased in 2006 from 1 533.00 ha (2000) to 1 651.50 ha. In 2018, the area was slightly smaller (1 635.90 ha), but there was a noticeable surface consolidation. Unlike watercourses, the number and area of water basins decreased from 384.42 ha in 1990 to just 94.45 ha in 2006, but in 2018 the area increased to 107.19 ha.
Scale of appropriate use
Regional level
Potential for aggregation: Change analysis of CLC habitat types vary among the protected areas.
Meaning of upward or downward trends („good or bad“)
It can be assumed that a reduction in the number of water basins caused an increase in the number of watercourses in 2006 and 2012, but the number of watercourses continued to decline in 2018. The cause of this can be changes in climate parameters. The results of the analysis of broadleaf forest surfaces, primarily of the wetland floodplain forests, show a decrease in the area of 11 458.14 ha in 1990 to 9 508.84 ha in 2006 with a higher degree of fragmentation. In the following period, the trend of increase in the area under forests (9 610.39 ha in 2018) was recorded, at the expense of the transitional forest/shrub surfaces. Increasing the surface of the transition area from 1 782.38 hectares in 1990 to 3 381.62 ha, corresponds to the changes recorded in the class of broad-leaved forests. It can be assumed that changes in these classes occurred in response to changes recorded in water basin and watercourse classes, that is, that a higher amount of water in water basins (107.19 ha) and a smaller number of watercourses positively influence the state of the natural forests and the transitional areas.
Possible reasons for upward or downward trends:
It is important to note that in this area there is a positive trend of changes in surface under land swamps while simultaneously consolidating these habitats, from 1 406.67 ha in 1990 to 1 493.55 ha in 2018. Oscillations in the change in the surface of these habitats can be related to changes in the surface of the watercourse class.
Implications for biodiversity management of change in the indicator:
Indicator is created due to necessity of creating Report to Convention on Biological Diversity.
Units in which it is expressed:
Surface in hectares (ha) or percentage of the territory or part of the territory. Regarding the land cover fragmentation, number of identified polygons is used.
Description of source data:
European Environment Agency (https://www.eea.europa.eu/publications/COR0-landcover), Serbian Environmental Protection Agency.
Calculation procedure:
According to CORINE Land Cover data, for particular Protected Area, were determined classes and their size in hectares (ha) and number of polygons for following years 1990, 2000, 2006, 2012 and 2018 using QGIS software. Percentage of change detection and number of polygons of each class are determined.
Most effective forms of presentation:
The most effective way to present results is using graphs, which helps to monitor trend-changes of classes. In combination with narratives are very useful regarding the possible explanation of the change causes.
Limits to userfelness and accuracy:
Smaller changes in vegetation cover, less than 25 ha regarding the Corine Land Cover methodology, cannot be identified. Precision of data relative to the surface to be monitored.
Updating the indicator:
(how often? Whats is the process?)
Indicator should be updated every 6 years, with coming-out new CLC map of Europe.
Closely related indicators
Forest area as a proportion of total land area, Habitat changes in UNESCO MAB biosphere reserves, CORINE Land Cover habitat changes in Protected Area in Serbia
Additional information and comments
Analysis should be conducted for the bigger protected areas, first of all to categories of National and Nature Parks etc.
Reference:
Popovic, S., & Dzoljic, J. (2016). Serbian Forest Indicators by CORINE Land Cover. Saarbucken, Germany: LAP LAMBERT Academic Publishing. Retrieved from http://www.sepa.gov.rs/download/publikacije/SerbianForestIndicatorsCorineLandCover.pdf
Table: Number of CORINE habitat polygons in PA Gornje Podunavlje
| CORINE habitat types | 1990 | 2000 | 2006 | 2012 | 2018 |
| 112 | 2 | 2 | 2 | 2 | 2 |
| 211 | 10 | 10 | 8 | 8 | 8 |
| 231 | 2 | 2 | 8 | 7 | 7 |
| 242 | 4 | 4 | 5 | 5 | 5 |
| 243 | 8 | 8 | 4 | 4 | 3 |
| 311 | 31 | 31 | 39 | 35 | 32 |
| 324 | 36 | 36 | 49 | 50 | 48 |
| 411 | 25 | 25 | 22 | 21 | 15 |
| 511 | 1 | 1 | 5 | 5 | 2 |
| 512 | 4 | 4 | 2 | 2 | 2 |