Key message: The amount of invested funds in protected areas have slightly increased
Assessment: Provincial Secretariat for Urban Planning and Environmental Protection financially supported the protected area managers in the Autonomous Province of Vojvodina during the period of 2002-2018. The annual amount of financial support depends on the financial plan adopted by the Provincial Assembly, prepared by the Provincial Secretariat for Urban Planning and Environmental Protection for each year, according to the overall budget for the Autonomous Province of Vojvodina. The funds were awarded within the call for proposals that is published each year for protected area managers, and to which managers applied with their project proposals. For the preparation of this indicator, data on the amount of funds spent on activities from the first and second groups were taken into account. It is important to notice that in the period from 2010-2011 funds were additionally provided through the Environmental Protection Fund of the Republic of Serbia.
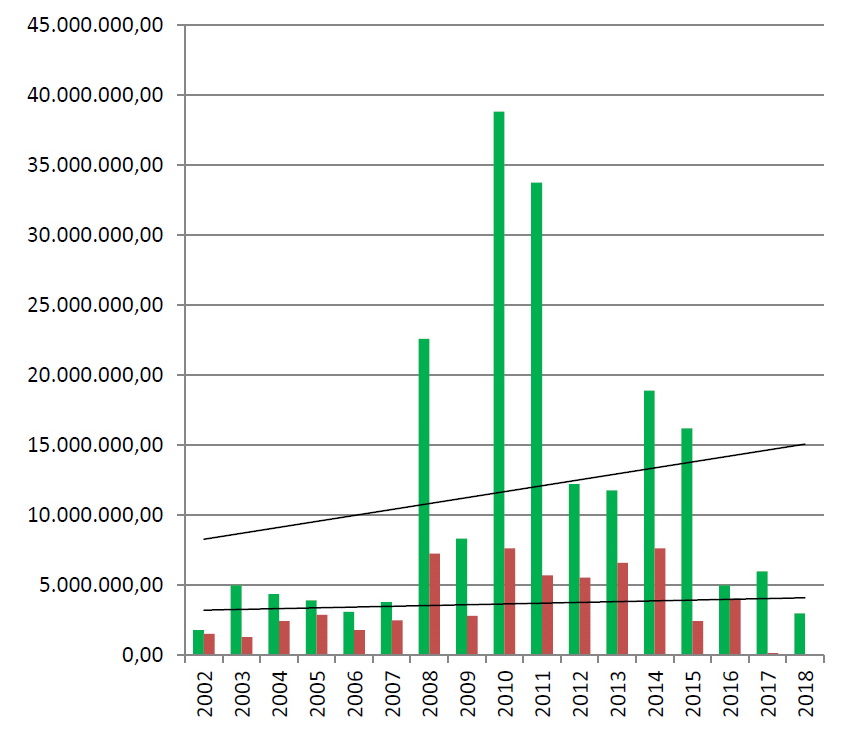
The results show that the funds varied from year to year, but reached the highest level during the period 2010-2011 due to additional financial sources. There is evident upward trend of the total funds per year, but only slight increase of funds for biodiversity conservation activities. The reason for this may be the increase in the number of projects, or managers who applied for the funds during the investigated period. Thus, during the first few years, between 2002 and 2007, the number of applicants was between 11-14, in the following period 2008-2016 the number gradually grew and ranged from 18-26. In practical terms, this means that “newly” applied managers are mainly applied with the projects on development of tourist infrastructure and only later on the activities of biodiversity conservation.
Indicator Name: Change in the amount of funds invested in the protected areas in Vojvodina
Institution/Author: Provincial Secretariat for Urban Planning and Environmental Protection/Lorand Vigh, Olivia Tesic, Tamara Stojanović
Use and interpretation:
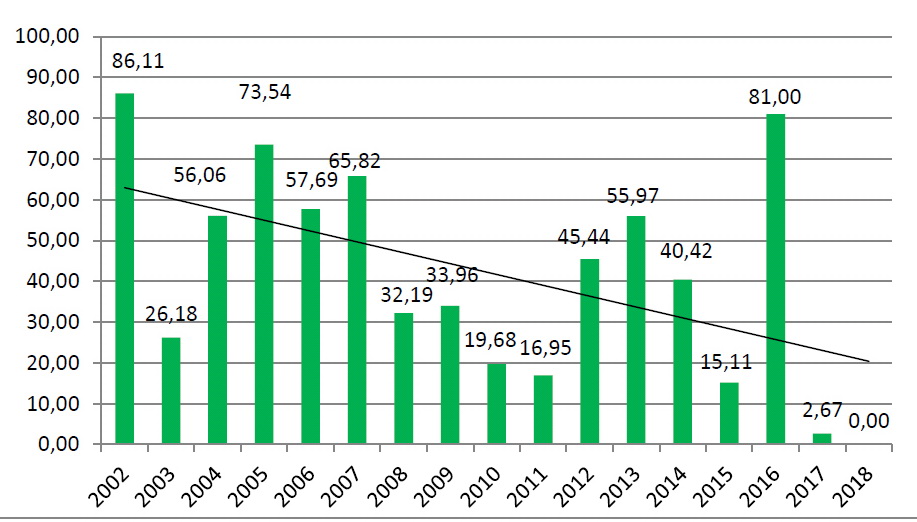
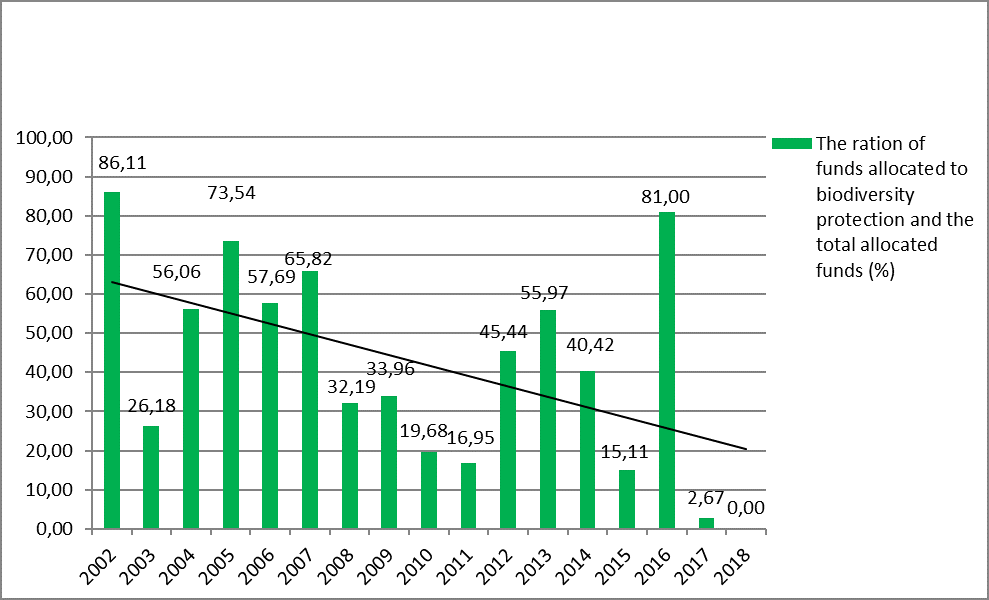
The Provincial Secretariat for Urban Planning and Environmental Protection financially supported the protected area managers in Autonomous Province of Vojvodina during the period of 2002-2018. The annual amount of financial support were dependant on the adopted financial plan by the Provincial Assembly prepared by the Provincial Secretariat for urban planning and Environmental Protection for each year according to the overall budget for the Autonomous Province of Vojvodina. The funds were awarded within the framework of a call for proposals that was announced each year for protected area managers and to which managers were applied with their project proposals. According to the guidelines of the call for proposals the eligible activities, as well as the amount of funds that can be allocated, are determined. There were three groups of financed activities: 1. Protection and improvement of the state of protected areas, especially biodiversity and rare and endangered species of plants and animals and their habitats; 2. Preservation, rehabilitation and revitalization of sensitive ecosystems; 3. Promotion of protected areas. For the preparation of this indicator, data on the amount of funds spent on activities from the first and second groups were taken into account. It is important to notice that in the period from 2010-2011, the funds were additional provided through the Environmental Protection Fund of the Republic of Serbia. The results show that the funds varied from year to year, but reached the highest level during the period 2010-2011 due to additional financial sources (Table 1). Due to trend line on Chart 1, there is evident upward trend of the total funds per year, but only slight increasing of funds for biodiversity conservation activities. The reason for this may be the increase in the number of projects, or managers who applied for the funds during the investigated period. Thus, during the first few years, between 2002 and 2007, the number of applicants was between 11-14, in the following period 2008-2016 the number was gradually increased and ranged from 18-26. In practical terms, this means that the “new” applied managers are mainly applied with the projects on development of tourist infrastructure and only later on the activities of biodiversity conservation. These changes are shown more clearly on the Chart 2, which presents the percentage ratio of total funds and funds spent on biodiversity conservation projects by downward trend.
Potential for aggregation:
bad
Possible reasons for upward or downward trends:
The annual amount of financial support depends on the adopted financial plan by the Provincial Assembly prepared by the Provincial Secretariat for Urban Planning and Environmental Protection for each year according to the overall budget for the Autonomous Province of Vojvodina. The amount of funds depends on the priorities and the decision of the provincial assembly, but also on the different requests of the managers considering activities on biodiversity protection. That is why the values vary so much over the years. In 2018, there were no financed project or activities on biodiversity conservation.
Implications for biodiversity management of change in the indicator:
Units in which it is expressed: Serbian dinars, %
(e.g. km2, number of individuals, % change)
Description of source data: Financial plans of Provincial Secretariat for Urban Planning and Environmental Protection, contracts with the protected area managers, project budget within the project application of the protected area managers
(origins, dates, units, sample size and extent, custodians)
Calculation procedure:
The indicator shows the ratio between total funds for the protected area managers and the funds allocated for the activities on biodiversity conservation.
(include appropriate methods and constraints for aggregation):
Most effective forms of presentation: Tables ang graphs
Chart 1. The relation between amount of overall funds for protected area managers and funds for biodiversity protection projects
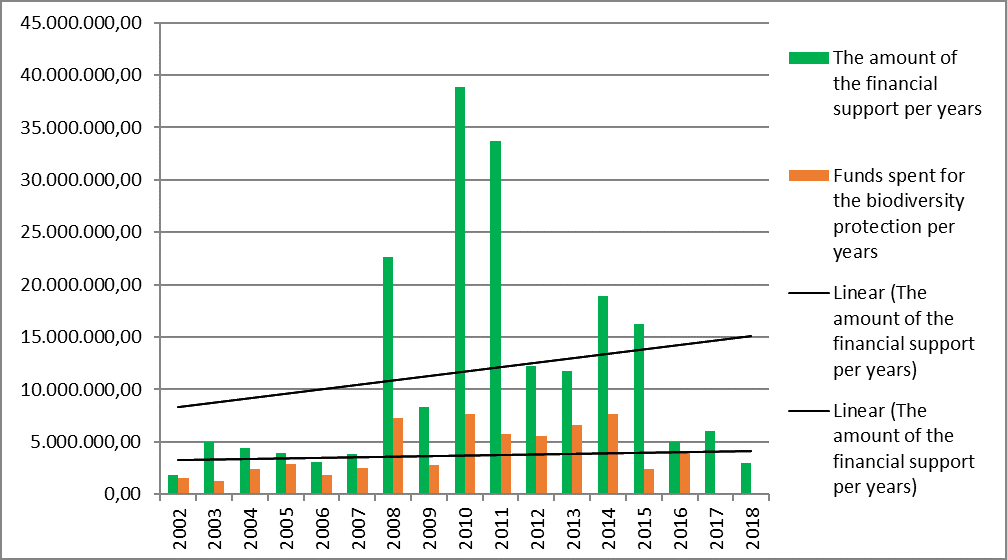
Chart 2. The percentage ratio between overall funds and funds for biodiversity conservation projects
(graph types, maps, narratives, etc.-give examples where possible):
Limits to usefulness and accuracy: –
(e.g. slow change in response to pressures, poor quality data, limited scope for updating)
Updating the indicator: per year
(how often? What is the process?)
Closely related indicators
Additional information and comments
Table 1. Overview of funds allocated to protected area managers in Vojvodina during 2002 – 2018
Years | All supported activities | Funds for biodiversity protection | % |
2002 | 1.800.000,00 | 1.550.000,00 | 86,11 |
2003 | 5.000.000,00 | 1.309.090,00 | 26,18 |
2004 | 4.370.000,00 | 2.450.000,00 | 56,06 |
2005 | 3.930.000,00 | 2.890.000,00 | 73,54 |
2006 | 3.120.000,00 | 1.800.000,00 | 57,69 |
2007 | 3.803.520,00 | 2.503.520,00 | 65,82 |
2008 | 22.605.100,00 | 7.276.500,00 | 32,19 |
2009 | 8.332.520,00 | 2.830.000,00 | 33,96 |
2010 | 38.824.498,00 | 7.641.168,00 | 19,68 |
2011 | 33.752.696,00 | 5.719.787,00 | 16,95 |
2012 | 12.232.100,00 | 5.558.285,00 | 45,44 |
2013 | 11.793.000,00 | 6.601.000,00 | 55,97 |
2014 | 18.906.000,00 | 7.642.040,00 | 40,42 |
2015 | 16.215.128,00 | 2.450.440,00 | 15,11 |
2016 | 5.000.000,00 | 4.050.000,00 | 81,00 |
2017 | 6.000.000,00 | 160.000,00 | 2,67 |
2018 | 3.000.000,00 | 0,00 | 0,00 |
Summary | 198.684.562,00 | 62.431.830,00 | 31,42 |