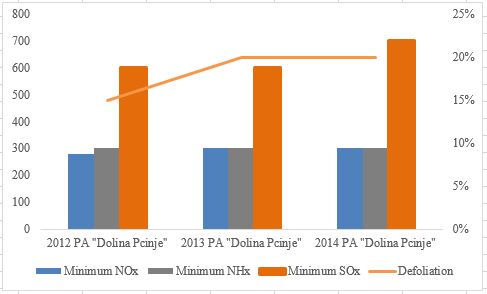
Key message: Increased concentration of SOx leads to greater defoliation
Assessment: The analysis of the most significant concentration of air pollutants (NOx, NHx and SOx) at the territory of Protected Area (PA) “Dolina Pčinje” during the period 2012 – 2014 shows positive correlation between NOx, SOx minimal detected concentration, and defoliation intensity of broad-leaves species. Concentration of NHx has not been changed, and therefore it cannot be directly linked to defoliation. According to the data of Republic Hydro-meteorological Service of Serbia over the last 20 years, noticeable change of climate parameters was registered, especially temperature and the amount of precipitation. Changes of climate conditions can indicate possible higher sensitivity of ecosystems, especially broad-leaves forests. Regarding the fact that Coal Power plant “Kosovo” in Obilić, Autonomous province Kosovo and Metohija, has influence on the air quality of Southern Serbia, and based on the result of the analysis, it can be concluded that its influence is not significant at this protected area (Džoljić, 2017), mostly due to the topography of the terrain.
Indicator Name: Air pollution and defoliation of forests in protected areas
Institution/Author: The Academy of Applied Technical and Preschool Studies – Department Vranje, Serbia/dr Jovana Džoljić; Environmental Protection Agency/Slaviša Popović
Use and interpretation:
The indicator describes the relationship between the concentration of NOx, SOx and NHx (gases forming the acidic sediments) and the state of forest ecosystems in protected areas in Serbia. More precisely, they describe whether and to what extent NOx, SOx and NHx have negative effects on the health condition of the forest, which can be monitored through the intensity of defoliation, i.e. through the damage occurring on the plant leaves.
Defoliation leads to numerous negative consequences on the ecosystem and biodiversity in general, because it reduces forest productivity, affects the change of the global carbon and nitrogen cycle, but it also negatively affects carbon sequestration which mitigates climate change. Thus, the role and importance of forest ecosystems is diminished.
Key question(s) which indicator helps to answer
The indicator provides the answer to the question: Does the concentration of NOx, SOx and NHx affect the degree of defoliation in protected areas?
Use of indicator:
The indicator is used to monitor the health status of forests in order to sustainably manage forests.
Scale of appropriate use
Regional, since the method used to estimate the concentration of air pollutants and defoliation observes the regions through parts of the geographic network with a spatial resolution of 50 x 50 km2 (Morán et al., 2016).
Potential for aggregation:
Meaning of upward or downward trends (“good or bad”)
According to the European Monitoring and Evaluation Programme (EMEP), the upward trend and concentrations of air pollutants and defoliation indicate their interdependence.
If the decrease in the concentration of the mentioned air pollutants is not accompanied by defoliation, their interdependence is not clear. This does not mean that it does not exist, since the change in the concentration of NOx, SOx and NHx has more far-reaching effects, which can be reflected through the increased sensitivity of forest ecosystems.
Possible reasons for upward or downward trends:
A clear upward trend in NOx, SOx and NHx concentrations indicates higher indirect anthropogenic pressure on protected areas such as e.g. increased traffic intensity, development and intensification of industry, and so on.
Defoliation can also be a consequence of higher sensitivity of certain parts of the ecosystem, which can be caused by climate change, herbivory or pathogenicity induced defoliation, and so on.
The declining trend of concentration of the mentioned air pollutants may be a consequence of the reduction of air pollution or the improvement of the environmental protection system against air pollution (installation of the latest filters in industrial plants, improvement of the traffic system, etc.)
Implications for biodiversity management of change in the indicator:
The indicator has been created for the reporting purposes towards the Convention on Biological Diversity.
Units in which it is expressed:
The indicator follows two parameters in in specific bio-indicator spots. Concentration of air pollutants is expressed in mg m-2, while defoliation degree is expressed in percentages (%).
Description of source data:
European Monitoring and Evaluation Programme (EMEP), Serbian Environmental Protection Agency.
Calculation procedure:
The EMEP methodology observes the regions in the world through parts of geographical network with spatial resolution of 50 x 50 km2. Defining the air pollutants emissions is carried out through direct measurements (if available) and/or through specific factors defined by E-PRTR21 base (Dios et al., 2014).
Most effective forms of presentation:
The best way to present indicator are graphs, providing the opportunity to monitor change relations between variables.
Limits to usefulness and accuracy:
Precision of data relative to the surface to be monitored.
Updating the indicator:
Data should be updated annually, provided by EMEP and SEPA.
Closely related indicators
Trends in Nitrogen Deposition, Forest area
Additional information and comments
Related to Aichi Biodiversity Target 8

Figure 1: Interdependance of NOx, NHx and SOx concentrations in air and defoliation intensity
The analysis of data on the concentrations of most prominent air pollutants (NOx, SOx and NHx) in PA “Dolina Pčinje”, in the period between 2012 and 2014, shows a positive correlation of minimally detected concentrations with increasing defoliation intensity of deciduous species. The NHx concentration was unchanged and could not be directly related to defoliation.
According to the HMIS data, over the past 20 years, changes in climatic factors in the south of Serbia have been recorded, primarily temperature and precipitation. Climate change indicates a possible increased sensitivity of ecosystems, especially of deciduous forests.
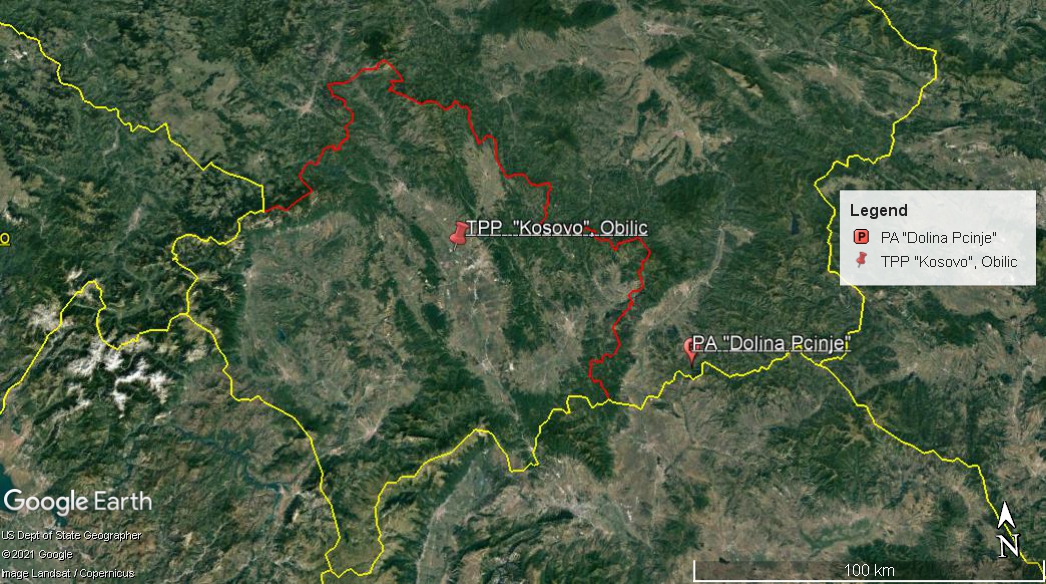
Considering the fact that TPP “Obilić” in Kosovo and Metohija has an impact on air quality in the south of Serbia (Džoljić, 2017), in the area of this protected area this impact has not been recorded, primarily due to the topography of the terrain (Map 1).
Map 1. Position of TPP “Obilić” and PA “Dolina Pčinje”

Literature:
Džoljić, J. (2017). Savremene metode praćenja radionuklida i ostalih parametara stanja životne sredine u funkciji optimalnog upravljanja zaštićenim područjima Pčinjskog okruga. Doktorska disertacija. Fakultet za ekologiju i zaštitu životne sredine, Univerzitet „Union-Nikola Tesla”, Beograd, Srbija. Available at: http://nardus.mpn.gov.rs/handle/123456789/9121
Morán, M., Ferreira, J., Martins, H., Monteiro, A., Borrego, C., & González, J. A. (2016). Ammonia agriculture emissions: From EMEP to a high resolution inventory. Atmospheric Pollution Research, 7(5), 786–798. http://doi.org/10.1016/j.apr.2016.04.001
Table: Air pollution and forest defoliation in selected protected areas
| (mgm-2) | ||||||||||
| defoliation | avarage | minimum NOx | maximum NOx | minimum SOx | maximum SOx | minimum NHx | maximum NHx | |||
| NOx | SOx | NHx | ||||||||
| 2012 LOF “Dolina Pcinje” | 15% | 300 | 750 | 350 | 280 | 320 | 600 | 900 | 300 | 400 |
| 2013 LOF “Dolina Pcinje” | 20% | 325 | 700 | 350 | 300 | 350 | 600 | 800 | 300 | 400 |
| 2014 LOF “Dolina Pcinje” | 20% | 325 | 750 | 350 | 300 | 350 | 700 | 800 | 300 | 400 |
Serbia